
Population: Growth, Density, Literacy, Sex-Ratio is an important demographic theme in Rajasthan Geography that helps in understanding the human resource profile and regional development patterns of the state. These indicators reveal trends in population increase, spatial distribution, educational status, and gender balance across districts. Together, they provide a base for planning, social policy, and balanced economic development in Rajasthan.
Population Status and Census Highlights
- Rajasthan has 5.67 % of the total population of India and about 1 % of the total population of the world.
- 2011 Census – 8th Rank in Population.
- At present, 7th Rank in population
- The decadal increase in the population of Rajasthan is around 1.20 crore.
- Population Growth Rate 21.31%
- Maximum Population increase – Jaipur District
- Jaipur is the 10th largest city in terms of Population in the Country.
- Census Motto-“Our Census, Our Future” First paperless census.
- 2011 Census Mascot – Female Enumerator
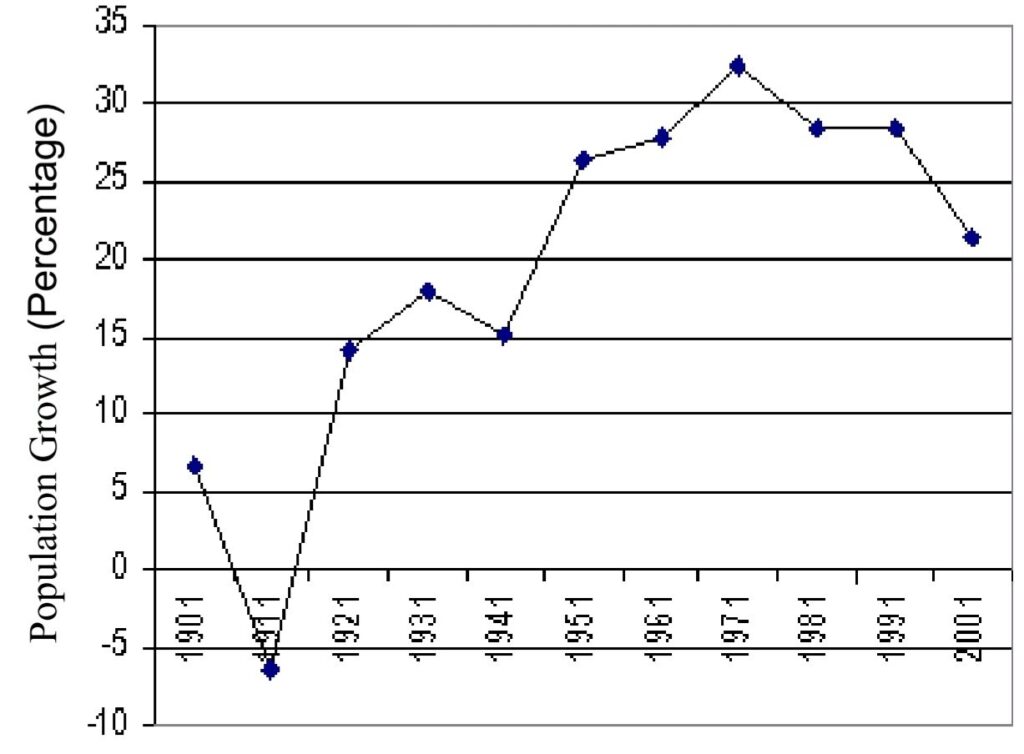
Population Growth
- The increase in the number of inhabitants of a particular area in a particular period is called population growth.
- Population growth = Total Birth – (Total death + migration)
- From 2001 to 2011, decadal Highest population growth was recorded in Jaipur district, 13.74 lakh, Lowest growth was recorded in Bundi, 1.48 lakh.
- The districts with 25% or more decadal growth rate are Barmer, Jaisalmer, Jodhpur, Jaipur, Jalore, Dungarpur and Banswara.
- In Rajasthan, in the 20th century, only during 1911-21, there was a decrease in the population.
- During 2001 to 2011, the decadal growth rate of population was 21.31% that is much higher than the Average of India (17.70%).
| District with the minimum population growth Rate | District with minimum population growth Rate |
| 1. Barmer – 32.5% 2. Jaisalmer – 31.8% 3. Jodhpur – 27.7% 4. Banswara – 26.58% | 1. Sri Ganganagar – 10% 2. Jhunjhunu – 11.7% 3. Pali – 11.9% 4. Bundi – 15.4% |
Population of Rajasthan
Maximum | Minimum |
|
|
Districts with the maximum male population
| Districts | Population |
| Jaipur | 34.69 lakh |
| Jodhpur | 19.39 lakh |
| Alwar | 19.24 lakh |
| Nagaur | 17.96 lakh |
| Udaipur | 15.67 lakh |
Districts with the minimum male population
| Districts | Population |
| Jaisalmer | 3.62 lakh |
| Pratapgarh | 4.38 lakh |
| Sirohi | 5.34 lakh |
| Bundi | 5.77 lakh |
| Rajsamand | 5.81 lakh |
Districts with the maximum female population
| Districts | Population |
| Jaipur | 31.57 lakh |
| Jodhpur | 17.63 lakh |
| Alwar | 17.35 lakh |
| Nagaur | 16.11 lakh |
| Udaipur | 15.01 lakh |
Districts with the minimum female population
| Districts | Population |
| Jaisalmer | 3.08 lakh |
| Pratapgarh | 4.30 lakh |
| Sirohi | 5.02 lakh |
| Bundi | 5.34 lakh |
| Rajsamand | 5.53 lakh |
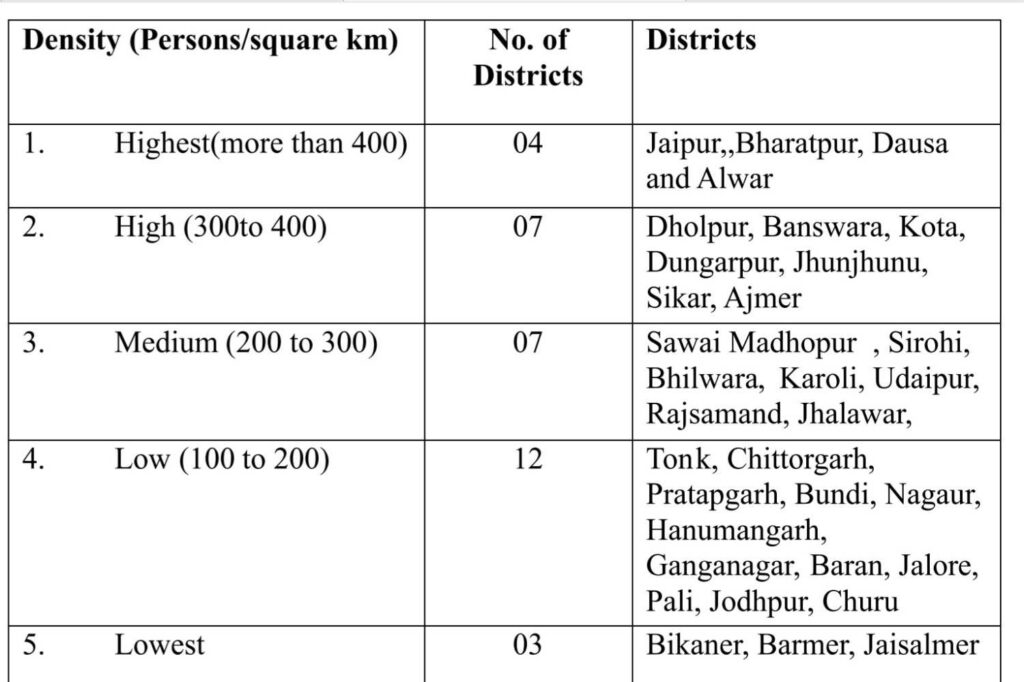
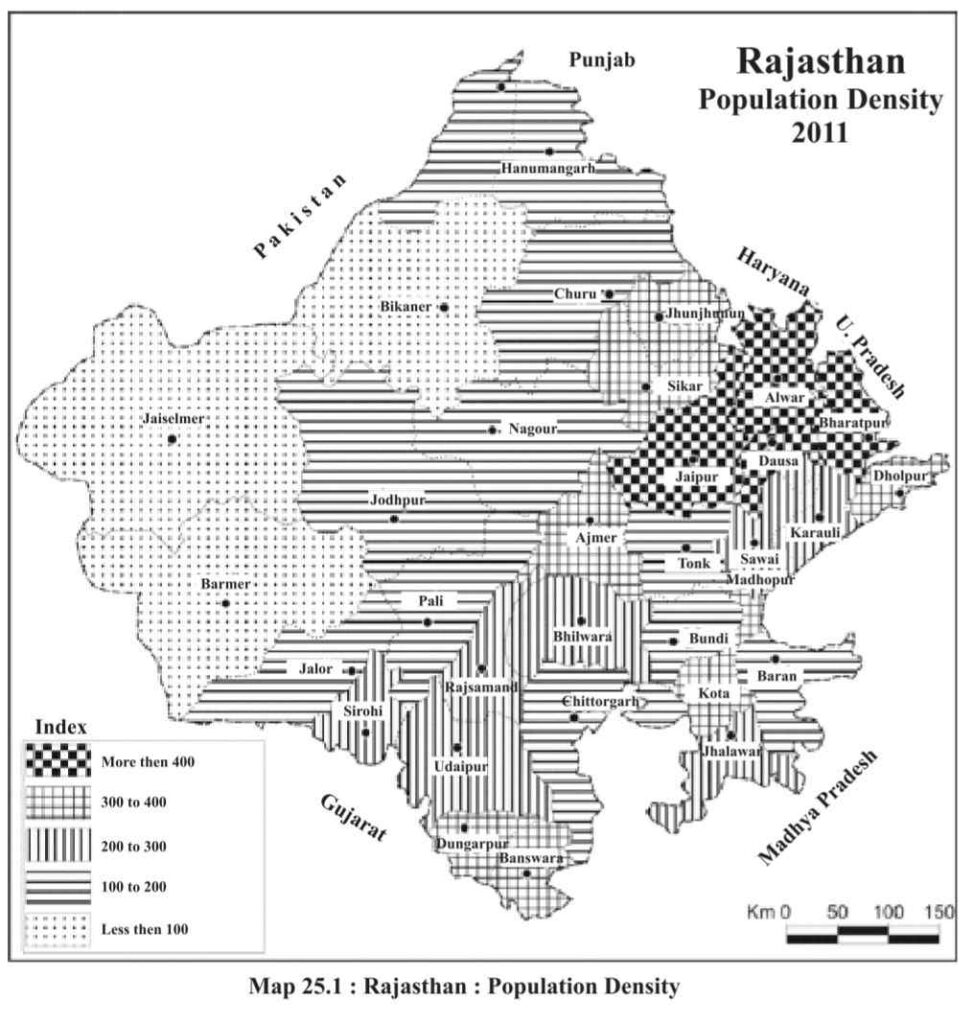
Population Density of Rajasthan
- Density of population – The number of persons living per square kilometre is called the density of population.
- Density of population = Total population/ Total Area
- Rajasthan has 10.41% of the total area of India and 5.66% of the total population. According to the 2011 census, the population density in Rajasthan is 200 persons per square kilometre.
- The population density of Rajasthan was 165 persons per square kilometre in 2001. It increased by about 35 people per square kilometre by 2011.
- There are 18 districts whose density is more than the state average (200).
- Sirohi (202) and Tonk (198) have almost equal density as Rajasthan.
- In the western and northern districts, due to the desert, the density is low. In the central region, population density is sparse due to hilly areas.
- Districts in the eastern and southern parts of the state are plain and more fertile, so they are more densely populated.
- Jaipur district has the highest population density of 595 people per sq. in Rajasthan. While it is only 17 persons per sq. km in the Jaisalmer district.
| Maximum | Minimum |
| Jaipur – 595 | Jaisalmer – 17 |
| Bharatpur – 503 | Bikaner – 78 |
| Dausa – 476 | Barmer – 92 |
| Alwar – 438 | Churu – 147 |
- From 2001 to 2011 districts with the highest increase in population density were
- Jaipur – 124 increase
- Dausa – 91 increase
- Bharatpur- 88 increase
- From 2001 to 2011, districts with the lowest decline in population density
- Jaisalmer – 4 points decline
- Bikaner – 15 decline
- Pali – 17 points decline
- Districts with population density less than 100 – Jaisalmer, Bikaner, Barmer.
- Districts with population density more than 400: Jaipur, Bharatpur, Dausa, Alwar.
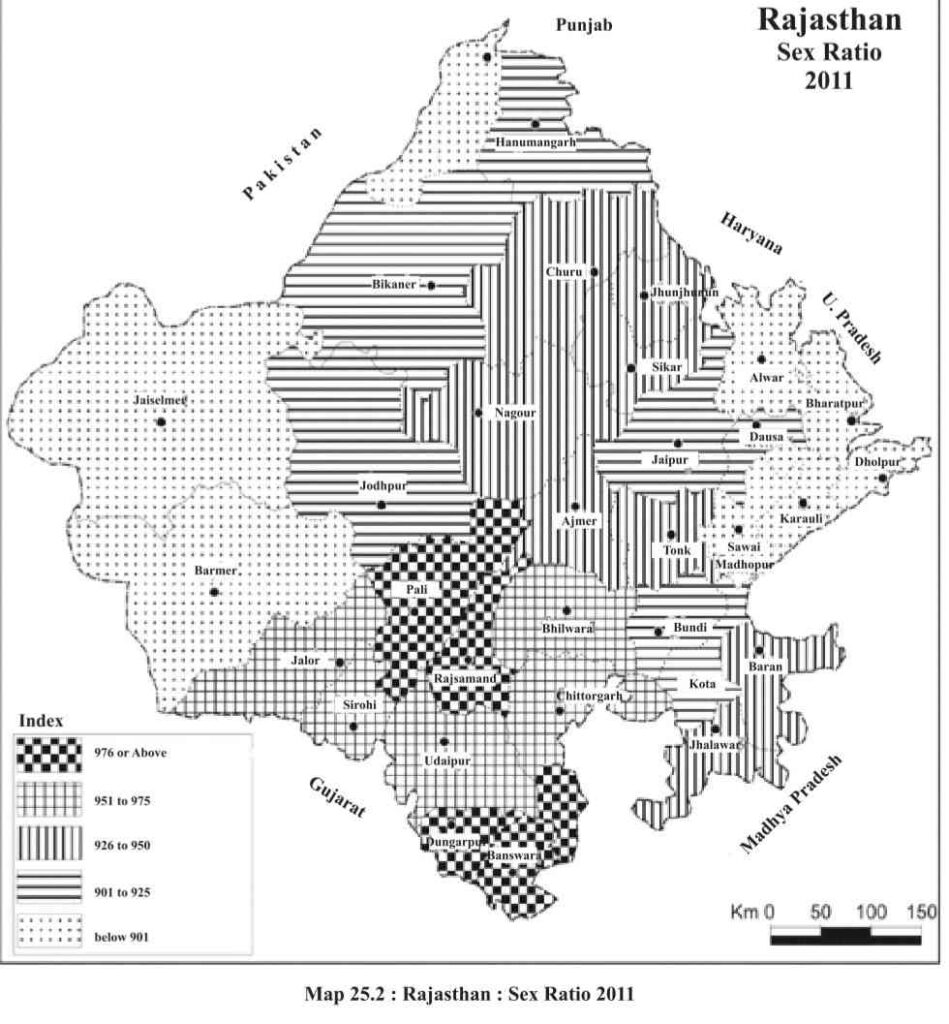
Sex Ratio
- The sex ratio of Rajasthan is 928, which is lower than the average national sex ratio (943) by 15 points.
- It was 921 in 2001 and continuously increasing since 1991-2021.
- In 2001 sex ratio was 921
- Sex ratio = (Total female population *1000)/( Total male population )
- According to the Census 2011, there is no district in Rajasthan which has a sex ratio of 1000 or more.
- In the western and northern districts of Rajasthan, the sex ratio is lower than the state‘s Average. In central Rajasthan and southern Rajasthan, the sex ratio is higher than the state’s average. The sex ratio in the tribal districts of the state is higher than in the non-tribal districts.
- In the 2001 Census, 2 districts – Dungarpur (1022) & Rajasamand (1000)
Districts with the Highest Sex Ratio | Districts with the Lowest Sex Ratio |
|
|
Districts of Rajasthan in which the Sex Ratio has decreased in comparison to the year 2001
| District | Year 2001 | Year 2011 | Reduction |
| Dungarpur | 1022 | 994 | 28 |
| Udaipur | 971 | 958 | 13 |
| Jalore | 964 | 952 | 12 |
| Rajasamand | 1000 | 990 | 10 |
| Churu | 948 | 940 | 8 |
| Sikar | 951 | 947 | 4 |
| Sirohi | 943 | 940 | 3 |
Highest Decline in Sex Ratio (2001 – 2011) | Highest Increase in Sex Ratio (2001 – 2011) |
|
|
Child Sex Ratio
- In the year 2011, the child sex ratio (0-6) remained 888 in the state. It is much lower than the average sex ratio of Rajasthan (928).
- In 2011, the Child Sex Ratio in urban areas decreased to 874 girls per 1,000 boys, while in rural areas it decreased to 892 girls per 1,000 boys.
- In this group (0–6), the sex ratio (number of girls per 1000 boys) in 2011 was 888 in the entire state of Rajasthan, which was 909 in the previous census of 2001.
- These are 3 districts in which the child sex ratio increased compared to 2001 data – Sri Ganganagar (from 850 to 854), Hanumangarh (from 872 to 878) and Jaisalmer (from 869 to 874).
- The highest proportion of population in the 0-6 age group is in Jaisalmer (19.47%), Barmer (19.26%) and Banswara (18.10%).
- The lowest proportion of population in the 0-6 age group is in Sri Ganganagar (12.97%), Kota (13.07%), and Hanumangarh (13.20%).
- Child Population (0-6 years) – 15.54% of total population of Rajasthan.
- The maximum decline in the child sex ratio has occurred in the following districts:
| District | 2001 | 2011 | Decline |
| Dausa | 906 | 865 | 41 decline |
| Jaipur | 899 | 861 | 38 decline |
| Sikar | 885 | 848 | 37 decline |
| Tonk | 927 | 892 | 35 decline |
Districts with the highest Child Sex Ratio | Districts with the lowest Child Sex Ratio |
|
|
Literacy in Rajasthan
- According to the Census, the percentage of people who can read and write among people aged 7 years or more is considered literate.
- The literacy rate of Rajasthan in 2011 was 66.11%, rising from 60.40 % in 2001.
| Total Literacy | Male Literacy | Female Literacy | |
| Census – 2011 | 66.1% | 79.2% | 52.1% |
| Census – 2001 | 60.41% | 75.7% | 43.9% |
| Growth | 5.69% | 3.5% | 8.2% |
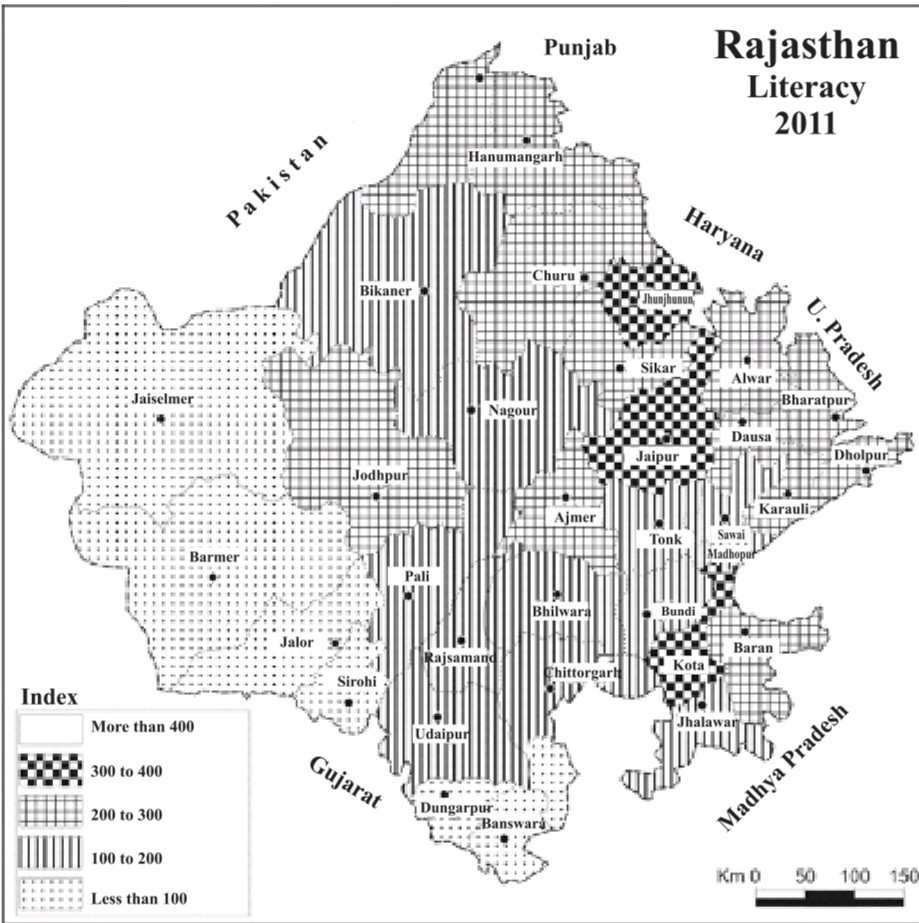
| Districts with minimum literacy rate | Districts with the maximum literacy rate |
| Jalore – 54.9% | Kota – 76.6% |
| Sirohi – 55.3% | Jaipur – 75.5% |
| Pratapgarh – 56.0% | Jhunjhunu – 74.1% |
| Banswara – 56.3% | Sikar – 71.9% |
| Barmer – 56.5% | Alwar – 70.7% |
Male literacy rate – 79.2% | Female literacy rate 52.1% |
Maximum
Minimum
| Maximum
Minimum
|
- The highest increase in literacy occurred during 2001-2011.
- Dungarpur – 10.9%
- Banswara – 10.8%
- Bhilwara – 10.75
- Tonk – 9.6%
- Jodhpur – 9.2%
- Decrease in literacy rate during 2001-2011
- Barmer – 2.5%
- Churu – 0.8%
Male and Female Literacy Change Trends (2001- 2011)
| Male Literacy (2001- 2011) | |
| Increase | Decrease |
| Banswara – 8% Bhilwar – 7.9% Dungarpur – 6.9% | Barmer – 1.9% Churu – 1.5% |
| Udaipur – No change | |
| Female Literacy Rate (2001- 2011) | |
| Increase | Decrease |
| Dungarpur – 14.4% Banswara – 13.9% Bhilwara – 13.8% | Barmer – 2.8% Churu – 0.4% |
- The literacy rate of “Karauli” is almost equal to the literacy rate of Rajasthan.
- The difference between Male and Female literacy rates is maximum in Rajasthan in the country.
- The gap between male and female literacy in Rajasthan is 27%
| Year | Rajasthan | India | |
| Literacy Rate | 2011 | 66.1 % | 73% |
| Literacy Rate (Male) | 2011 | 79.2% | 80.9% |
| Literacy Rate (Female) | 2011 | 52.1 % | 64.6% |
| Work participation rate | 2011 | 43.6% | 39.8% |
Schedule Caste
- According to the 2011 census, the Scheduled caste population of Rajasthan is 17.8 %
- According to the 2011 census, the Scheduled caste population of India is 16.6 %
| Maximum Number of scheduled caste | Minimum Number of scheduled caste |
| Jaipur Sri-Ganganagar Nagaur | Dungarpur Pratapgarh Banswara |
| Districts with the highest % of scheduled caste | Districts with Lowest % of the scheduled caste |
| Sri-Ganganagar – 36.6% Hanumangarh- 27.8% | Dungarpur 3.8 % Banswara 4.5 % |
| Sex ratio in scheduled caste – 923 | |
| Highest sex ratio – Rajsamand (982) | Lowest sex ratio – Dholpur (863) |
