
Environment and ecological changes and their impact is a key topic in Science and Technology, covering climate change, deforestation, desertification, pollution, and disturbances in ecological systems. International frameworks such as UNFCCC, IPCC, and UNCCD, along with initiatives on carbon markets, renewable energy, and ozone layer protection, address rising carbon emissions and environmental degradation. These ecological changes affect natural cycles, biodiversity, and vital ecosystems like corals and mangroves, making environmental protection essential for sustainable development.
Environment and ecological changes and their impact
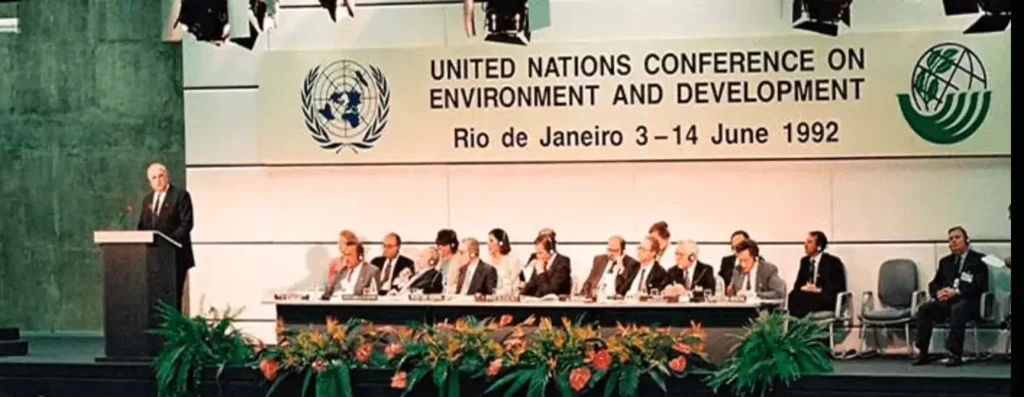
The history of the Rio Summit can be traced back to the 1972 United Nations Conference on the Human Environment held in Stockholm, Sweden. The Rio Summit 1992, or UNCED, was held in Rio de Janeiro, Brazil, from 3 to 14 June 1992. It was one of the largest gatherings of heads of state and government representatives at that time, involving leaders and officials from 178 countries, as well as representatives from international organisations and thousands of NGOs.
Rio Earth Summit 1992 Outcomes
- Participation of 178 nations, making it one of the largest multilateral conferences of its time.
- Adoption of legally binding treaties such as the UNFCCC and the Convention on Biological Diversity (CBD).
- Introduction of soft law instruments like the Rio Declaration and Agenda 21.
- Recognition of the principle of Common But Differentiated Responsibilities (CBDR).
UNFCCC (United Nations Framework Convention on Climate Change)
- UNFCCC sets an overall framework for intergovernmental efforts to tackle the challenge posed by climate change.
- Its objectives are to stabilize greenhouse gas concentrations in the atmosphere at a level that would prevent dangerous human interference with the climate system, within a time-frame sufficient to allow ecosystems to adapt naturally to climate change.
- The secretariat was established in 1992 when countries adopted the UNFCCC. The original secretariat was in Geneva. Since 1996, the secretariat has been located in Bonn, Germany.
- India ratified the UNFCCC in 1993.
- Entered into force in 1994.
- UNFCCC COP – Supreme decision–making body of UNFCCC.
- Meets every year (unless parties decide otherwise).
- First COP: 1995, Berlin (Germany).
Major COP | Agreements |
COP 3 (Japan) | Kyoto protocol
Kyoto Mechanisms (Flexible Market Tools)
|
COP 7 (2001) |
|
COP 8 (2002) |
|
COP 13 (2007) |
|
COP 15 (2009) |
|
COP 16 (2010) |
|
COP 18 (2012) | Doha, Qatar Doha Amendment (2013–2020)
|
COP 19 (2013) – |
|
COP 21 |
|
COP26 |
Panchamrit
|
COP 27 (2022) Sharm el-Sheikh, Egypt |
|
COP 28Dubai | Global stocktake
|
COP 29 Baku, Azerbaijan |
|
COP 30 Brazil | Theme: Delivering on the Paris Promise – shifting focus from pledges to implementations of its actions. Major Outcome: Belem Political Package (final statement removed fossil fuel phase-out reference).
Key Outcomes as feature:
|
COP 31 | Turkiye will be the host country in 2026.The host for COP is not decided by vote. It has to be a consensus decision. |
COP 32 | Addis Ababa,Ethiopia 2027 |
Desertification
- Desertification is the degradation process by which a fertile land changes itself into a desert by losing its flora and fauna.
- It is the process by which the biological productivity of drylands is reduced due to natural or manmade factors. It does not mean the expansion of existing deserts.
Causes of desertification
- The main human activities driving desertification are:
- Poor agricultural practices, from not rotating crops to unprotected soils or chemical fertiliser and pesticide use, etc.
- Overexploitation of natural resources, for example, irresponsible management of vegetation or water.
- Bad livestock practices, such as overgrazing, which severely erode the land and prevent the regeneration of vegetation.
- Urbanization and other types of land development.
- Climate Change – Climate change and desertification have strong interactions. Desertification affects climate change through loss of fertile soil and vegetation. Soils contain large amounts of carbon, some of which could be released to the atmosphere due to desertification, with important repercussions for the global climate system.
- Stripping the land of resources
- Natural Disasters
- Deforestation, causes of which go beyond tree felling, which increases the risk of fires, among others.
Deforestation
- Deforestation is the large-scale removal of forests or trees from land, which is then converted for non-forest uses like farming (crops, ranching), mining, or urban development, leading to habitat loss, soil erosion, biodiversity decline, and significant contributions to climate change.
- Some important facts
- The 30th UN Climate Conference (COP30) in Belem, Brazil, ended with a political agreement, known as the Global Mutirao Agreement, that commits nations to prepare two major roadmaps: one to halt and reverse deforestation, and another to “transition away” from fossil fuels.
- While the forest roadmap received broad support, the final text avoided binding commitments on fossil fuel phase-out, underscoring sharp geopolitical divisions.
- Fossil Fuels: The Most Divisive Issue at COP30
- Demands for a Phase-Out Over 80 countries, including the EU and small island nations, pushed for explicit language requiring a phase-out of fossil fuels, the world’s largest source of greenhouse gas emissions. They sought a clear timeline and measurable commitments.
- Resistance from Developing Nations Major developing economies, India, China, Russia, Saudi Arabia, and South Africa, opposed binding phase-out language. Their arguments included: National energy needs and development priorities, Concerns over inadequate climate finance, Rejection of uniform global timelines that disregard domestic realities.
- India and several BRICS members insisted that energy transitions must be nationally determined, not externally imposed.
- Outcome: A Non-Binding ‘Transition Away’ Roadmap
- As a compromise, COP30 adopted: A broad commitment to “transition away from fossil fuels”, but No timeline, No mandatory reduction pathway, and a separate voluntary roadmap, announced by the President, outside the formal COP text.
REDD (Reducing Emissions from Deforestation and Forest Degradation)
- UN initiative (launched 2008) to help developing countries reduce forest loss.
- Supported by: FAO, UNDP, UNEP.
- Objectives of REDD – Reduce deforestation & forest degradation, Increase carbon stocks (via afforestation, reforestation, better forest management), Provide financial incentives for measurable emission reductions
- Deforestation contributes heavily to global CO₂ emissions. REDD reduces emissions by rewarding countries financially for protecting forests.
REDD Financial Mechanism
- Countries first identify current or projected deforestation rates.
- If they reduce these rates → they are financially rewarded.
- Forests gain economic value by storing carbon, making conservation profitable.
- REDD offers low-cost emission reductions compared to other mitigation measures.
- Bali Action Plan (2007 – COP 13) – Recognized REDD as a key climate solution. Called for policies and incentives to reduce emissions from forest loss in developing countries.
Note:- In 2008, conservation, sustainable forest management, and enhancing forest carbon stocks were added. Led to the expanded mechanism known as REDD+.
REDD+
- An expanded version of REDD adopted in 2010 (COP-16, Cancun Agreements).
- Rewards developing countries for: Reducing forest emissions, conserving forests, sustainably managing forests, enhancing forest carbon stocks
- REDD+ recognizes the full value of forests beyond just preventing deforestation. Provides result-based payments — money only for verified emission reductions.
Desertification and Land Degradation in India and Rajasthan (ISRO – Atlas 2021):
Desertification and Land Degradation Atlas – published by ISRO.
- The Atlas provides a state wise area of degraded lands for the time frame 2018-19. It also provides the change analysis for the duration of 15 years, from 2003-05 to 2018-19.
- Land Degradation: Some 97.85 million hectares (29.7%) of India’s total geographical area (TGA) of 328.72 mha underwent land degradation during 2018-19.
- State wise Data:
- Around 23.79% of the area undergoing desertification land degradation with respect to TGA of the country was contributed by Rajasthan, Maharashtra, Gujarat, Karnataka, Ladakh, Jharkhand, Odisha, Madhya Pradesh and Telangana.
- India witnessed an increase in the level of desertification in 28 of 31 states and Union territories between 2011-13 and 2018-19.
- India
- The most significant process of desertification/ land degradation in the country is
- Water Erosion (11.01% in 2018-19, 10.98% in 2011-13 and 10.83% )
- Vegetation Degradation (9.15% in 2018-19, 8.91% in 2011-13 and 8.60% in 2003-05)
- Wind Erosion (5.46% in 2018-19, 5.55 % in 2011-13 and 5.58 % in 2003-05).
- Rajasthan
- 2018–19: 62.06% (21.23 million ha) of total geographical area under DLD(Desertification and Land Degradation).
- 2011–13: 62.90% (21.52 million ha).
- 2003–05: 63.19% (21.62 million ha)
- Trend: Overall slight decrease in degraded area (by 0.84% = 2,88,847 ha) from 2011–13 to 2018–19.
Processes of Degradation
- Wind Erosion – most significant 43.37% (2018–19), 44.41% (2011–13).
- Decreased by ~3.5 lakh ha (2011–13 to 2018–19).
- Vegetation Degradation 7.64% (2018–19), 7.62% (2011–13)
- Increased slightly by 8418 ha (2011–13 to 2018–19).
- Water Erosion 6.21% (2018–19), 6.18% (2011–13).
- Increased by ~27,000 ha (2011–13 to 2018–19).
- Salinity 1.07% (2018–19), 1.06% (2011–13)
- Increased by ~2000 ha.
- Other minor processes: Water logging, manmade factors, barren/rocky, settlement (less than 1% each).
Note:-
- Wind erosion is the dominant cause of land degradation in Rajasthan (≈ 43–45% share).
- Slight reduction in wind erosion area but increase in vegetation and water erosion.
- Overall DLD slightly improved between 2003–05 (63.19%) → 2018–19 (62.06%).
UNCCD (United Nations Convention to Combat Desertification)
- The UNCCD was introduced by the recommendations of the 1992 Rio Earth Summit (UNCED), where Agenda 21 highlighted the growing dangers of desertification and called for a global response. Adopted in Paris on 17 June 1994 and entering into force in December 1996, it was designed to provide countries with a cooperative platform to address land degradation through sustainable land management.
- Its COP is held biennially and recent COP 16 was held in Riyadh, Saudi Arabia.
- India ratified the convention in 1996.
- The World Day to Combat Desertification and Drought 2025, observed on June 17, focuses on the theme “Restore the Land. Unlock the Opportunities”.
Major COP | Agreements |
COP 14 | Delhi Declaration (2019)
|
COP 15 | Abidjan, Côte d’Ivoire. 2022
|
COP 16 | Riyadh, Saudi Arabia 2024
|
COP 17 | Mongolia (2026) |
Global Environment Facility
- It was established on the eve of the 1992 Rio Earth Summit of UNFCCC to help tackle our planet’s most pressing environmental problems.
- It is a family of funds dedicated to confronting biodiversity loss, climate change, pollution, and strains on land and ocean health.
- It provides financial assistance to five major international environmental conventions:
- Minamata Convention on Mercury.
- Stockholm Convention on Persistent Organic Pollutants (POPs).
- United Nations Convention on Biological Diversity (UNCBD)
- United Nations Convention to Combat Desertification (UNCCD)
- United Nations Framework Convention on Climate Change ( UNFCCC)
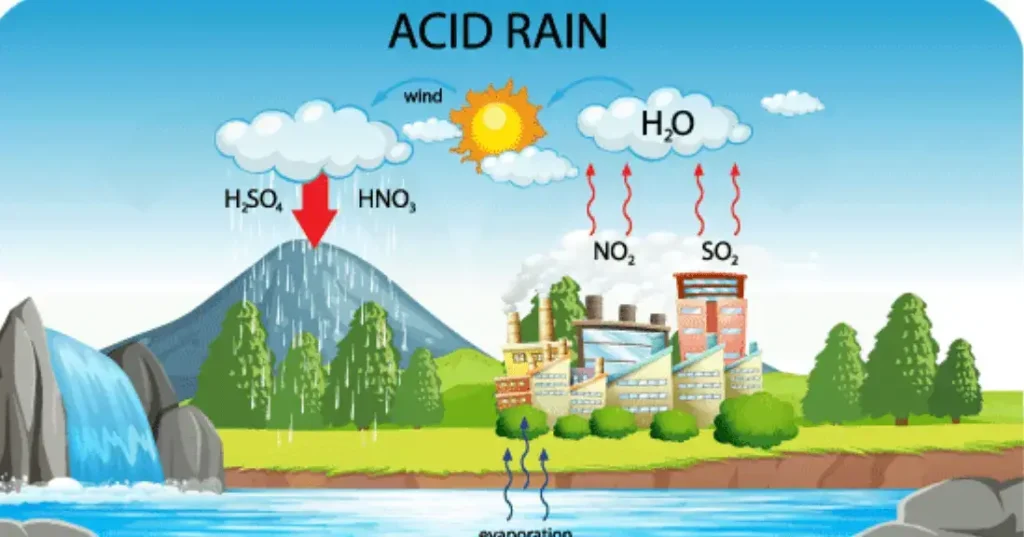
Acid rain
- Acid rain is defined as a combination of dry and wet deposition from the atmosphere having higher than normal concentrations of nitric acid (HNO₃), sulfuric acid (H₂SO₄), and acidifying compounds which lead to a decrease in the pH of rainwater to less than 5.61.
- Acid rain sample converts blue litmus to red.
- The ratio H₂SO₄ and HNO₃ in acid rain is 7:3.
- Types of Acid Rain:
- Wet deposition – when acid falls to the ground in the form of rain, snow, fog, or mist.
- Dry deposition – when acid chemicals get incorporated into dust or smoke and settle on the ground, buildings, cars, etc.
- Other acids in acid rain: formic acid, phosphoric acid, hydrochloric acid, carbonic acid.
Climate change
- Climate Change is one of the defining challenges of the 21st century, reshaping ecosystems, weather patterns, and human societies across the globe.
- Climate is the long-term average of a region’s weather events. The Earth’s climate is not static.
- However, when today people talk about ‘climate change’, they mean the changes in climate over the last 100 years which is caused predominantly by human activity.
- Climate change is the measurable effects of the continual warming trend. Climate change is usually measured by major shifts in temperature, rainfall, snow, and wind patterns that persist for decades or longer.
- Humans are creating climate change by burning large amounts of fossil fuels (coal, oil, natural gas) deforestation (when forests are cut down or burned, they can no longer store carbon, and the carbon is released into the atmosphere).
Global warming
- This refers to the steady rise in Earth’s average surface temperature, mainly caused by human activities such as the burning of fossil fuels. The greenhouse gases like carbon dioxide (CO₂) and methane (CH₄) traps heat in the atmosphere, intensifying the warming effect.
- In common usage, “global warming” often refers to the warming that can occur as a result of increased emissions of greenhouse gases from human activities.
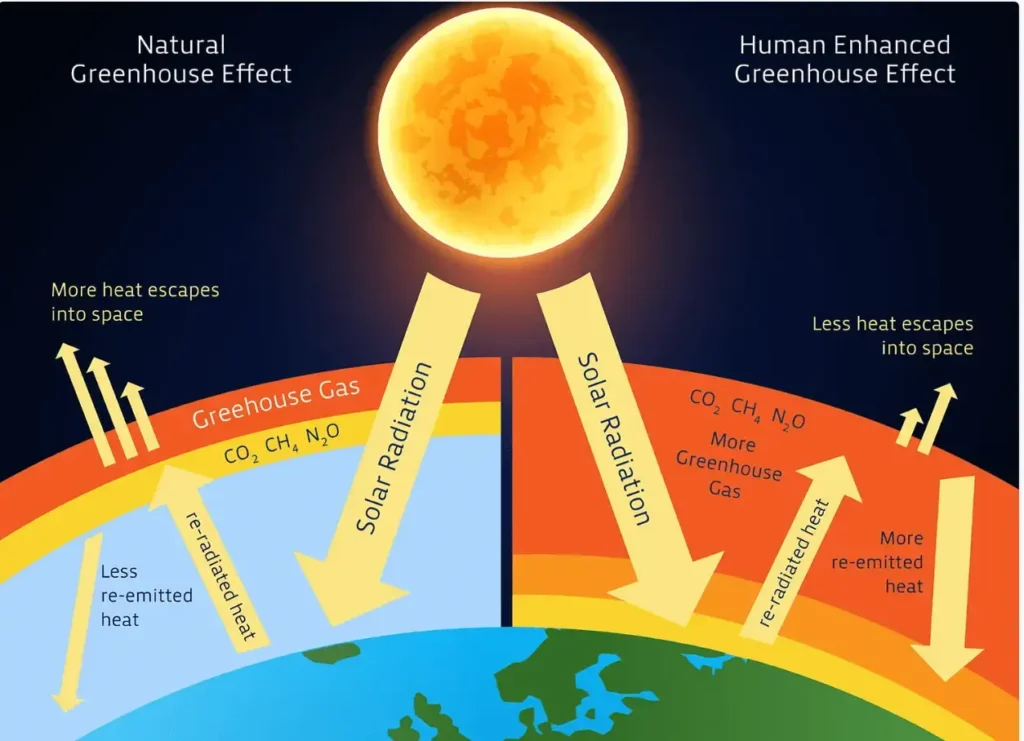
Greenhouse effect
- The greenhouse effect is the process by which heat is trapped near Earth’s surface by the substances known as ‘greenhouse gases.’ Imagine these gases as a cozy blanket enveloping our planet, helping to maintain a warmer temperature than it would have otherwise.
- Greenhouse gases consist of carbon dioxide, methane, ozone, nitrous oxide, chlorofluorocarbons, and water vapor. Water vapor, which reacts to temperature changes, is referred to as a ‘feedback’, because it amplifies the effect of forces that initially caused the warming.
- Greenhouse gases are part of Earth’s atmosphere. This is why Earth is often called the ‘Goldilocks’ planet – its conditions are just right, not too hot or too cold, allowing life to thrive. Natural greenhouse effect, which maintains an average temperature of 15 °C (59 °F).
- According to one estimate, in the absence of a naturally occurring greenhouse effect, the average temperature of the earth surface would be -19 degree C.
- However, in the last century, human activities, primarily from burning fossil fuels that have led to the release of carbon dioxide and other greenhouse gases into the atmosphere, have disrupted Earth’s energy balance. This has led to an increase in carbon dioxide in the atmosphere and ocean. The level of carbon dioxide in Earth’s atmosphere has been rising consistently for decades and traps extra heat near Earth’s surface, causing temperatures to rise.
Greenhouse gases
Water Vapour
- Largest contributor to natural greenhouse effect.
- Humans don’t emit it directly in large amounts, but other GHGs (especially CO₂) increase temperature → more evaporation → more water vapour.
- Short-lived in atmosphere (quickly evaporates and returns as rain/snow).
- Acts as a feedback, not a direct human-driven forcing.
Carbon Dioxide (CO₂)
- Main GHG emitted by humans.
- Part of natural carbon cycle (air, oceans, soil, plants).
- Human causes: Burning fossil fuels, Deforestation (reduces carbon sinks), Industrial processes.
- Staying for centuries, a major reason for post-industrial warming.
Methane (CH₄)
- Comes from wetlands (natural) and human sources like: Cattle/livestock, rice fields, landfills
- Leakage during natural gas extraction/transport.
- Removed by chemical reactions from atmosphere and soil.
- More powerful than CO₂ but shorter lifetime.
Nitrous Oxide (N₂O)
- Natural part of nitrogen cycle.
- Increased by human activities like : Agriculture (fertilizers, manure), fossil fuel burning, wastewater management, industrial processes.
- High warming potential + long atmospheric life.
Fluorinated Gases
- Fully industrial, not natural.
- Used in refrigerants, electronics manufacturing, aerosols, substitutes for ozone-depleting substances.
- Very high Global Warming Potential and longest-lasting GHGs.
- Destroyed only by high energy UV sunlight in the far upper atmosphere.
Types:
- HFCs (Hydrofluorocarbons)
- PFCs (Perfluorocarbons)
- SF₆ (Sulfur Hexafluoride) – extremely high GWP
India’s Progress Towards Climate Resilience
- India pledged to achieve net-zero emissions by 2070 at the 26th Conference of the Parties (COP 26) in 2021.
- India submitted its 4th Biennial Update Report (BUR-4) to the UNFCCC on 30th December 2024.
- The report shows a 7.93% reduction in total GHG emissions in 2020 with respect to2019.
- India’s historical share of cumulative global GHG emissions is 4% annually, despite having around 17% of the world’s population between 1850 and 2019.
- India’s annual primary energy consumption per capita in 2019 was 28.7 gigajoules (GJ), considerably lower than both developed and developing countries.
Climate Action Initiatives for Carbon Neutrality
- The government has proactively undertaken various initiatives to address environmental challenges in the country. Some of the significant measures are listed below:
1. Forest Land Diversion & Mitigation Measures
- Forest Fragmentation Consideration: Forest fragmentation is addressed during forest land diversion approvals for non-forestry purposes under the Van Adhiniyam, 1980.
- Compensatory Afforestation: Mandatory afforestation for non-forestry land diversion, including soil and moisture conservation, and eco-restoration.
- “Ek Ped Maa Ke Naam” tree plantation Campaign: Nationwide tree plantation campaign launched on World Environment Day 2024.
- Green Credit Program: Launched in 2023, the program focuses on tree plantation on identified degraded forest land parcels to generate green credits.
- National Afforestation Programme (NAP): Pan-India afforestation in identified degraded forest areas with people’s participation and decentralized forest governance.
2. Urban Climate Adaptation & Low-Carbon Development
- Mainstreaming Adaptation in Urban Planning: India’s LT-LEDS emphasizes integrating adaptation measures and enhancing energy and resource efficiency within urban planning policies and guidelines as key components of a low-carbon development pathway.
- Sustainable Urban Planning Policies: The relevant policies and initiatives include urban and regional development Plans Formulation and Implementation (URDPFI) guidelines, Town and Country Planning Act, Smart Cities Mission, Atal Mission for Rejuvenation and Urban Transformation (AMRUT), Pradhan Mantri Awaas Yojana (PMAY) and Swachh Bharat Mission (SBM).
3. Air Pollution Control & Clean Air Initiatives
- National Clean Air Programme (NCAP): Aimed at improving air quality with city-specific action plans for 131 cities.
- Funding & Implementation: Mobilized through various schemes such as SBM (Urban), AMRUT, Sustainable Alternative towards Affordable Transportation (SATAT), Faster Adoption and Manufacturing of Hybrid and Electric Vehicles (FAME-II) and Nagar Van Yojna.
- Air Pollution Abatement Measures: Initiatives include cleaner fuels (CNG/LPG), ethanol blending, BS VI fuel norms, and air quality management.
4. Coastal Ecosystem Conservation & Resilience
- Mangrove & Coral Reef Conservation: Financial assistance provided to coastal states/UTs for enhancing climate resilience, including mangrove conservation.
- Integrated Coastal Zone Management Plans (ICZMP) Plans for Coastal States: Prepared for Gujarat, Odisha, and West Bengal for coastal ecosystem protection.
- Mangrove Initiative for Shoreline Habitats & Tangible Incomes (MISHTI) Program: Mangrove restoration/reforestation program launched in 2023, covering approximately 540 km² across 9 coastal states and 4 UTs.
5. Regulatory Measures for Climate Resilience
- The Coastal Regulation Zone (CRZ) Notifications (2011 & 2019), issued under the Environment Protection Act, 1986, Wildlife Protection Act, 1972, Indian Forest Act, 1927, and Biological Diversity Act, 2002 for enhancing the climate resilience. The 2019 CRZ notification specifically targets the management of mangroves, coral reefs, and other critical ecosystems.
Black Carbon
- Not a gas, but a solid particulate pollutant (soot) formed due to incomplete combustion.
- Made of pure carbon particles.
- Major sources: Diesel engines, biomass burning, cooking with solid fuels, forest fires, industrial combustion.
Effects
- Strong absorber of sunlight → warms atmosphere.
- Deposits on snow and glaciers, reduces albedo, accelerates melting (Himalayas, Hindu Kush).
- Affects monsoon, clouds, regional climate.
- Short atmospheric lifetime: few days to weeks → impact reduces quickly if emissions are controlled.
- India’s Contribution – India + China contribute 25–35% of global black carbon, mainly due to wood & cow-dung burning, diesel, household fuels.
- Control Measures – Improved cookstoves, biogas, solar cookers, clean fuel technology.
Brown Carbon
- Light-absorbing organic aerosol (part of particulate matter, not a gas).
- Absorbs sunlight but less strongly than black carbon.
Sources
- Biomass burning (especially domestic wood burning)
- Cooking with solid fuels
- Diesel exhaust
- Agricultural forest
- Organic tar-like aerosols, humic substances, bioaerosols
Global warming potential
- Global warming potential describes the impact of each gas on global warming.
- The two most important characteristics of a GHG in terms of climate impact are how well the gas absorbs energy (preventing it from immediately escaping to space), and how long the gas stays in the atmosphere.
| Gas | Global Warming Potential (100 year) | Lifetime (years) |
| Carbon dioxide | 1 | 100 |
| Methane | 21 | 12 |
| Nitrous oxide | 310 | 120 |
| Hydro fluoro carbons (HFCs) | 140-11,700 | 1-270 |
| Perfluoro carbons (PFCs) | 6,500-9,200 | 800-50,000 |
| Sulphur hexafluoride (SF6) | 23,900 | 3,200 |
Carbon emissions
Carbon capture and storage, also known as CCS or carbon sequestration, describes the technologies designed to tackle global warming by capturing CO2, at power stations, industrial sites or even directly from the air and permanently storing it underground.
Carbon sequestration
- Long-term storage of carbon dioxide or other forms of carbon to either mitigate or defer global warming. Carbon sequestration may be carried out by pumping carbon into ‘carbon sinks‘ , an area that absorbs carbon.
- Natural sinks – Oceans, forests, soil etc.
- Artificial sinks – Depleted oil reserves, unmineable mines, etc.
- Steps in Carbon Capture and Storage (CCS) There are three main steps:
- Capture: Separating CO₂ from other gases at industrial sites or from the air.
- Transport: Moving captured CO₂ to a storage site (via pipelines/ships).
- Storage: Storing CO₂ deep underground or in oceans to keep it away from the atmosphere.
Types of Carbon Sequestration
- Ocean Sequestration – CO₂ is stored in deep oceans by direct injection or fertilization (e.g., iron fertilization to stimulate phytoplankton growth).
- Geologic Sequestration – CO₂ stored in natural underground rock formations (e.g., porous rock, depleted oil fields). Considered the best near-term option.
- Mechanisms: Hydrodynamic trapping: CO₂ trapped under low-permeability rock caps. Solubility trapping: CO₂ dissolves into liquids (water/oil).
- Terrestrial Sequestration – CO₂ stored in plants, soils, forests, croplands.
- Methods include: Afforestation / reforestation, Soil carbon enhancement, Reduced decomposition via land management, Increased organic matter.
Carbon Capture, Utilization and Storage (CCUS) (NITI Aayog Framework)
- Objectives: Promote CCUS as a tool for decarbonization.
- Develop technologies for CO₂ reduction in hard-to-abate sectors (cement, steel, etc.).
- Features: Captures CO₂ from flue gases and atmosphere.
- CO₂ reused to make: Fuels (methanol, methane), Refrigerants, Building materials (cement, plastics)
- Helps in: Enhanced Oil Recovery (EOR), Bio-plastics & green chemicals, Food & beverage industry
- CO₂ utilization opens huge employment opportunities.
Carbon Sink
Green Carbon
- Carbon stored in plants and soil through photosynthesis. High in forests and natural terrestrial ecosystems.
- Biomass stores carbon for decades or centuries.
- Measures to increase green carbon: Afforestation, Reforestation, Soil carbon enhancement
Blue Carbon
- Stored in coastal ecosystems: Mangroves, Marshes, Seagrasses
- Importance: Store 3–5× more carbon than tropical forests. Store carbon for centuries to millennia. Prevent coastal erosion Provide breeding grounds for marine life
- Blue Carbon Initiative: Global program to conserve and restore coastal ecosystems. Includes international collaboration via IUCN, UNESCO, IOC, etc.
Carbon Credit
- Definition: A tradable certificate allowing emission of 1 tonne of CO₂ or equivalent gases.
- Organizations earn carbon credits when they: Emit less CO₂ than permitted limits, use clean technologies, adopt emissions – reducing processes
- Companies in developing nations can sell surplus credits to developed countries. Encourages cleaner production worldwide.
Carbon Offsetting
- Definition: Reducing emissions in one place to compensate for emissions in another.
- Examples: Planting trees, Wind farms, Solar power projects, Community green projects
- Benefits: Supports local jobs and development, reduces emissions globally, helps companies meet climate targets.
Carbon Tax
- Definition: A tax imposed on fuels based on their carbon content.
- Aim: To reduce fossil fuel use and promote clean energy.
- Benefits Over Cap-and-Trade: Simple to understand, Harder to manipulate, Promotes efficiency, Encourages green innovation
- India’s View: May challenge unfair “carbon taxes” on Indian imports at WTO.
Carbon Border Adjustment Mechanism
- It is a European Union (EU) tariff on carbon-intensive products.
- It is a new EU instrument for preventing carbon leakage, that is, the shifting of the production of goods to non-EU countries where there is a lower or no carbon cost associated with their production.
- CBAM will apply in its definitive regime from 2026, while the current transitional phase lasts between 2023 and 2025.
- The CBAM commenced in its transitional phase as of 1 October 2023.
- Carbon Certificates: If implemented as planned, EU importers will have to buy carbon certificates corresponding to the carbon price that would have been paid in the EU if the goods had been produced locally.
- The price of the certificates would be calculated according to the auction prices in the EU carbon credit market.
- CBAM is part of the “Fit for 55 in 2030 package“, which is the EU’s plan to reduce greenhouse gas emissions by at least 55% by 2030 compared to 1990 levels in line with the European Climate Law.
Indian Carbon Market (ICM) & Carbon Credit Trading Scheme (CCTS)
India’s Progress in Reducing Emission Intensity –
- India has successfully decoupled economic growth from GHG emissions. India reduced emission intensity by 33% (2005–2019). India is firmly on track to meet its climate commitments under the Paris Agreement.
- Indian Carbon Market (ICM) to help India in achieving the NDC goal of reducing Emissions Intensity of the GDP by 45 percent by 2030 against 2005 levels
- Energy Conservation Amendment Act, 2022 – Establishes the regulatory framework for the Indian Carbon Market.
- Section 14(w) empowers the Central Government (with BEE) to: Specify the Carbon Credit Trading Scheme (CCTS).
Carbon Credit Trading Scheme (CCTS)
- Objective – To price GHG emissions through a formal carbon market. To decarbonize the Indian economy using market-based incentives.
- Carbon Credit Trading Scheme (CCTS) adopted in July 2024.
- To expand the carbon market through:
- Compliance Mechanism For obligated entities (energy-intensive industries):
- Must meet prescribed GHG emission intensity reduction norms.
- Entities that overachieve targets are issued Carbon Credit Certificates (CCC).
- Offset Mechanism For non-obligated entities:
- Can register projects that reduce / remove / avoid greenhouse gas emissions.
- Eligible for issuance of Carbon Credit Certificates.
- Examples: Renewable energy projects, Energy efficiency projects, Carbon removal technologies, Waste management, methane reduction projects.
- Nine Sectors Identified for CCTS Compliance – Aluminium, Cement, Steel, Paper, Chlor-Alkali, Fertilizer, Refinery, Petrochemical, Textile.
Transition from PAT Scheme to CCTS
- PAT Scheme (2012): Market-based mechanism to improve energy efficiency. Applicable to Designated Consumers (DCs) in energy-intensive sectors. Industries receive targets to reduce Specific Energy Consumption (SEC).
Carbon Pricing
- Carbon pricing puts a financial cost on greenhouse gas emissions. Polluters pay for the environmental damage they cause.
- Encourages industries to: Reduce emissions, Shift to clean energy, Invest in low-carbon technologies
India’s Progress
- India is developing: A rate-based Emissions Trading System (ETS), Voluntary carbon crediting mechanisms
- Rate-Based ETS – Total emissions are not capped. Instead, industries are given emission intensity benchmarks (emissions per unit of output). Companies performing better than the benchmark earn Carbon Credit Certificates.
- New Crediting Methodologies – On 28 March 2025, Ministry of Power approved 8 methodologies including: Renewable Energy, Green Hydrogen, Industrial Energy Efficiency, Mangrove Afforestation & Reforestation These support voluntary carbon markets in India.
Government Efforts to Strengthen Carbon Market
Mission LiFE
- A global movement for sustainable living.
- Focus: Behaviour change: reducing waste, saving energy, recycling.
- Making people Pro-Planet People (P3).
- Goals: Engage 1 billion global citizens by 2028. Convert 80% of villages and urban bodies into green communities.
Green Credit Program (GCP)
- Launched: October 12, 2023.
- A voluntary market-based mechanism that rewards tree plantation on degraded forest land.
- Function – Forest departments list land parcels → Land Bank. Participants choose blocks for plantation. After planting and maintaining for 10 years → Green Credits issued. (Choose land → Plant trees → Care for them for 10 years → Earn Green Credits)
- Credits verified through: Satellite monitoring, Digital tracking, Third-party audits
- Goals – Expand forest cover, Restore degraded land, Encourage voluntary climate action
National Steering Committee for the Indian Carbon Market (NSCICM)
- Role – Apex body managing India’s carbon market.
- Functions – Recommend rules & procedures for carbon trading, Set emission intensity targets. Guide issuance and trading of credits
Prakriti 2025
- The international conference on carbon markets ‘Prakriti 2025’ was organized in New Delhi on 24-25 February 2025.
- The conference was inaugurated by Power and Housing and Urban Affairs Minister Manohar Lal on 24 February.
- UN Goodwill Ambassador and actress Dia Mirza also attended the conference.
- This conference focuses on bringing together various initiatives to tackle climate change, raise awareness, share information and strengthen resources
Note:- Nature Restoration Law (NRL)
- It is a landmark environmental regulation enacted by the European Union (EU). It aims to halt and reverse the degradation of ecosystems across the EU, addressing both climate change and biodiversity loss.
- Member States must restore at least 20% of the EU’s land and sea by 2030. By 2050, all ecosystems needing restoration should be included.
Renewable energy
- “Green Future, Net Zero” aren’t just fancy words but reflect India’s need and commitment, making it the best destination for investment and innovation in renewable energy. – Prime minister
- India ranks 4th globally in Renewable Energy Installed Capacity, 4th in Wind Power, and 3rd in Solar Power capacity, (IRENA RE Statistics 2025)
- As of 30 September 2025, the country’s total installed electricity capacity has crossed 500 GW, reaching 500.89 GW. This achievement reflects years of strong policy support, investments, and teamwork across the energy sector.
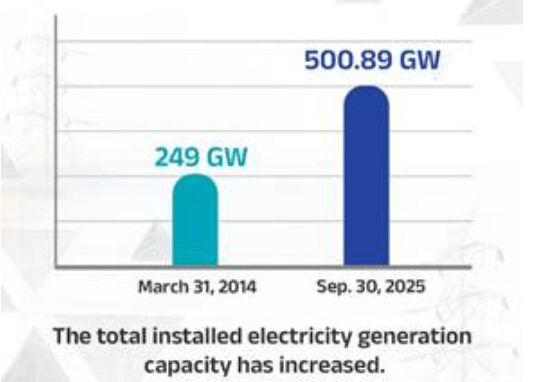
India’s Power Capacity
- Non-fossil fuel sources (renewable energy, hydro, and nuclear): 256.09 GW – over 51 % of the total.
- Solar power – 127.33 GW
- Wind power – 53.12 GW
- Fossil-fuel-based sources: 244.80 GW – about 49 % of the total.
- Renewable energy is energy that is generated from natural resources that are continuously replenished. This includes sunlight, geothermal heat, wind, tides, water, and various forms of biomass. This energy cannot be exhausted and is constantly renewed.
Renewable energy
- Solar energy – energy generated from the sun
- Hydel energy – energy derived from water
- Biomass – energy from firewood, animal dung, biodegradable waste and crop residues, when it is burnt.
- Geothermal energy- energy from hot dry rocks, magma, hot water springs, natural geysers, etc.
- Ocean thermal – energy from waves and also from tidal waves.
- Co-generation – producing two forms of energy from one fuel.
- Fuel cells are also being used as a cleaner energy source.
Solar energy
- India lies in the tropical region, with the Tropic of Cancer passing through many states. This gives the country a high potential for solar power generation.
- The total solar sector potential of the Indian continent is 748 GW.
- States/ UTs like Rajasthan, Jammu and Kashmir, Maharashtra, Madhya Pradesh, and Andhra Pradesh have some of the highest solar potential in the country.
- Palli village in Jammu & Kashmir became a notable example, emerging as India’s first carbon-neutral panchayat by running entirely on solar power
- India’s cumulative installed solar power capacity stood at 127.33 GW
KEY FLAGSHIP INITIATIVES IN SOLAR ENERGY:
PM Surya Ghar: Muft Bijli Yojana
- PM Surya Ghar Muft Bijlee Yojana is a central scheme with an outlay of Rs. 75,021 crores to help one crore Indian households to get up to 300 units of free electricity every month by installing rooftop solar panels.
- The government provides a subsidy of ₹30,000 for 1 kW, ₹60,000 for 2 kW, and ₹78,000 for 3 kW rooftop solar systems or higher.
- Even if a family takes a loan to install the system, they can still save about ₹15,000 every year on electricity bills after paying the monthly loan EMI.
PM-KUSUM (Pradhan Mantri Kisan Urja Suraksha Evam Utthaan Mahabhiyan)
- The PM-KUSUM scheme supports farmers in using solar energy instead of diesel.
- Farmers can get a 30% to 50% subsidy to install new solar pumps or convert old pumps to solar. They can also build solar power plants up to 2 MW on their own land and earn money by selling electricity to local DISCOMs.
- The scheme is carried out by state implementing agencies.
Moreover, it is aimed at ensuring energy security for farmers in India, along with honouring India’s commitment to increase the share of installed capacity of electric power from non-fossil fuels sources to 50% by 2030 as part of Intended Nationally Determined Contributions (INDCs).
Solar Parks Scheme
- The government is running a scheme called “Development of Solar Parks and Ultra Mega Solar Power Projects” to set up large solar power plants connected to the electricity grid, with a target of 40 GW by March 2026.
- Large solar parks now provide low-cost electricity, while wind farms in Gujarat and Tamil Nadu meet India’s evening power needs. Bioenergy projects are boosting rural incomes through job creation.
PM JANMAN: Empowering PVTG Communities through Solar Electrification
- The Pradhan Mantri Janjati Adivasi Nyaya Maha Abhiyan (PM JANMAN) was launched to address the development needs of Particularly Vulnerable Tribal Groups (PVTGs) through 11 critical interventions across 9 Ministries.
- A key initiative under this mission and Dharti Aaba Janjatiya Gram Utkarsh Abhiyan (DA JGUA) is the New Solar Power Scheme, with an outlay of ₹515 crore, aimed at electrifying one lakh un-electrified households in Tribal and PVTG habitations across 18 states, promoting inclusive growth and sustainable energy access in remote tribal areas.
Increase in Solar PV Manufacturing Capacity
- Since 2014, India’s capacity to make solar PV cells has grown about 21 times, going up from 1.2 GW in 2014 to about 25 GW by March 2025. Similarly, the capacity to make solar PV modules has grown more than 34 times, rising from 2.3 GW in 2014 to about 78 GW by March 2025
Other Important initiatives
- Floating Solar Projects: The Omkareshwar Floating Solar Park in Madhya Pradesh is one of Asia’s largest floating solar parks, with a planned capacity of 600 MW. It costs ₹330 crore, with ₹49.85 crore support from the Centre.
- Agrivoltaics: Agrivoltaics use solar panels and allow farming underneath, increasing land use and farmer income. Projects like the Sun Master Plant in Delhi and a 105 KW system by ICAR in Jodhpur show India’s progress in clean energy.
International Solar Alliance (ISA):
- Launched by India and France at COP21 in 2015, the ISA is a global alliance of 100+ countries working to combat climate change through solar energy.
- Headquarter – Gurugram, Haryana.
- It aims to mobilise $1 trillion in investments by 2030, reduce technology and financing costs, and promote affordable solar solutions.
- With a special focus on Least Developed Countries (LDCs) and Small Island Developing States (SIDS), the ISA seeks to drive low-carbon growth through cost-effective and transformational energy solutions.
ONE SUN- ONE WORLD- ONE GRID (OSOWOG)
- The ‘One Sun, One World, One Grid’ (OSOWOG) initiative, launched by India at the ISA Assembly in 2018, envisions a global solar grid under the idea that ‘the sun never sets.’ Led by ISA, it aims to connect solar resources across regions from South Asia to Africa and Europe, with studies and frameworks already underway.
Note:- Global Solar Atlas (GSA)
- It is a free, web-based tool developed by the World Bank’s Energy Sector Management Assistance Program (ESMAP) in collaboration with Solargis.
- Global Solar Atlas (GSA) provides high-re Explanation data and maps to assess solar energy potential across the globe, especially in developing countries.
Wind Energy
- India added 4.15 GW of wind energy in FY 2024–25, taking the total installed capacity to 51.6 GW.
- India ranks 4th globally in onshore installed wind capacity with 52.14 GW installed (as of 31 July 2025).
- Wind power generated 83.35 billion units from Apr 2024 to March 2025, contributing 4.56% to total electricity.
- The country has a wind potential of 1164 GW and an annual manufacturing capacity of 18 GW.
- Offshore wind development is guided by the National Offshore Wind Energy Policy (2015), with MNRE as the nodal ministry for projects along India’s coastline.
Bioenergy
- India has 11.60 GW of bioenergy capacity. To support this, the National Bioenergy Programme (2021–2026) was launched with a ₹1715 crore budget, offering central financial help for setting up bioenergy projects across the country under the following components.
- Waste to Energy Programme (Programme on Energy from Urban, Industrial and Agricultural Wastes /Residues)
- Biomass Programme (Scheme to Support Manufacturing of Briquettes & Pellets and Promotion of Biomass (non-bagasse) based cogeneration in Industries)
- Biogas Programme (Programme to support setting up of small (1 m3 to 25 m3 biogas per day) and medium size Biogas plants i.e., above 25 m3 to 2500 m3 bio gas generation per day)
Biofuel (Ethanol) Blending
- India is now the world’s third-largest ethanol producer and consumer. Ethanol blending in petrol increased from 10% in June 2022 to 17.98% by February 2025.
- The government aims to reach 20% blending by 2025–26, ahead of the earlier 2030 target.
- This is supported through subsidies, lower GST, and long-term purchase deals. Ethanol and biodiesel, made from biomass, are key biofuels that help reduce dependence on fossil fuels for transport.
Hydro Energy
- The country has a potential of 21.1 GW from 7,133 sites, mostly in hilly states.
- India already has 5.11 GW installed, with more under development. Large hydro and pumped storage projects are also growing, with 133.4 GW hydro and 181.4 GW pumped storage potential.
- In India, hydro projects up to 25 MW are called Small Hydro Power.
- The government supports these with benefits like tariff help and transmission charge waivers.
Green Hydrogen
- Green hydrogen is made by splitting water into hydrogen and oxygen using solar or wind energy.
- The demand for green hydrogen is growing fast because it can help reduce emissions and pollution in many areas like transport, shipping, and steel production.
The National Green Hydrogen Mission
- It was launched by the Government of India to cut carbon emissions and make India a global leader in green hydrogen.
- By 2030, the goal is to produce 5 million tonnes of green hydrogen every year, bringing in ₹8 lakh crore investments, creating 6 lakh jobs, and saving ₹1 lakh crore in fossil fuel imports.
- To push this forward three major ports namely Kandla, Paradip and Tuticorin ports have been identified by Ministry of Ports, Shipping and Waterways (MoPSW) to be developed as Green Hydrogen hubs.
Meeting National Targets Ahead of Time
- India has already achieved one of its major COP26 Panchamrit goals — to have 50 % of installed electric power capacity from non-fossil fuel sources by 2030 — five years early.
- This success highlights India’s leadership in clean energy transition, achieved while keeping the electricity grid stable and reliable.
- Ministry of New & Renewable Energy (MNRE) is working to reach 500 GW of non-fossil fuel capacity by 2030.
- Renewable energy alone has grown almost three times, from 76.37 GW in 2014 to 233.99 GW in 2025, showing a strong move toward a cleaner and sustainable future
Nationally determined contributions NDC
- Under the Paris Agreement, each country is required to submit and update their Nationally Determined Contribution (NDCs) every 5 years, outlining their plans for reducing greenhouse gas emissions and adapting to climate change.
India’s NDC
- To promote and further propagate a healthy and sustainable way of living based on traditions and values of conservation and moderation, including through a mass movement for ‘LiFE’- ‘Lifestyle for Environment’ as a key to combating climate change. [Updated]
- To reduce Emissions Intensity of its GDP by 45% by 2030, from 2005 level. [Updated]
- To achieve about 50% cumulative electric power installed capacity from non-fossil fuel-based energy resources by 2030, with the help of transfer of technology and low-cost international finance including support from Green Climate Fund (GCF). [Updated]
- To create an additional carbon sink of 2.5 to 3 billion tonnes of CO₂ equivalent through additional forest and tree cover by 2030.
Other
- To adopt a more climate-friendly and cleaner development path compared to what developed countries had at the same stage.
- To adapt better to climate change by investing more in vulnerable sectors like agriculture, water, Himalayas, coasts, health, and disaster management.
- To mobilize money from both domestic sources and developed countries to support mitigation and adaptation measures.
- To build capacity and promote quick transfer of modern climate technologies in India, along with international collaboration in R&D.
IPCC (Intergovernmental Panel on Climate Change)
- Created in 1988 by the World Meteorological Organization (WMO) and the United Nations Environment Programme (UNEP)
- It is an intergovernmental body of the United Nations (UN) for assessing the science related to climate change.
- The objective of the IPCC is to provide governments at all levels with scientific information that they can use to develop climate policies.
- The IPCC published its First AR in 1990, second in 1995, third in 2001, fourth in 2007 and the Fifth Assessment Report in 2014
Sixth Assessment Report (AR6)
- Key findings
- Unprecedented Global Warming:
- Human activities, principally through emissions of greenhouse gasses, have unequivocally caused global warming, with global surface temperature reaching 1.1°C above 1850-1900 in 2011-2020
- Already, with 1.1 degrees Celsius of global temperature rise, changes to the climate system that are unparalleled over centuries to millennia are now occurring in every region of the world, from rising sea levels to more extreme weather events to rapidly disappearing sea ice.
Ozone layer
- Ozone is a natural toxic gas consisting of 3 atom of Oxygen
- It is found in two different layers – Troposphere and stratosphere.
- Ozone in the troposphere is harmful as it pollutes air and contributes to the formation of photochemical smog.
- Ozone in the stratosphere is good as it protects harmful UV radiation. Ozone is found in the stratosphere at the height of 16 km to 50 km.
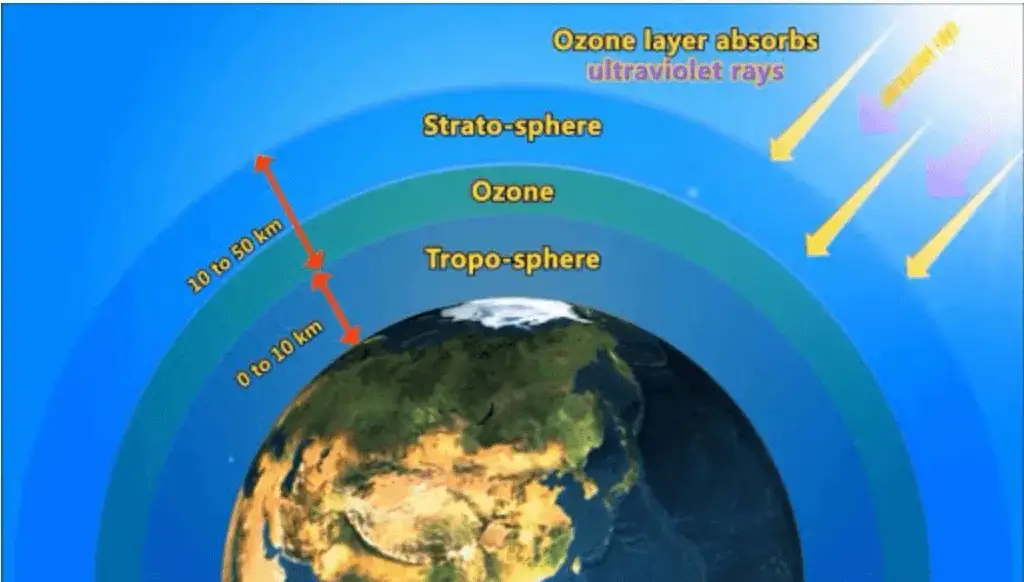
- Ozone, is a deadly poison. However, at the higher levels of the atmosphere, ozone performs an essential function. It shields the surface of the earth from ultraviolet (UV) radiation from the Sun. This radiation is highly damaging to organisms, for example, it is known to cause skin cancer in human beings.
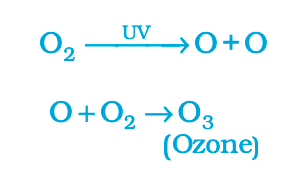
- Ozone at the higher levels of the atmosphere is a product of UV radiation acting on oxygen (O2) molecule. The higher energy UV radiations split apart some moleculer oxygen (O2) into free oxygen (O) atoms. These atoms then combine with the molecular oxygen to form ozone as shown
Ozone layer depletion
- The formation and destruction of ozone in the stratosphere is a natural phenomena. Stratospheric ozone does not contribute to greenhouse gases.
- Ozone layer depletion is the thinning of the ozone layer present in the upper atmosphere.
- The amount of ozone in the atmosphere began to drop sharply in the 1980s. This decrease has been linked to synthetic chemicals like chlorofluorocarbons (CFCs) which are used as refrigerants and in fire extinguishers.
- The thickness of the ozone layer is measured in the dobson unit. If the thickness of the ozone layer is less than 220 dobson units it is called an ozone layer hole.
Reasons for Ozone layer depletion
Chlorofluorocarbons
- These are released by solvents, spray aerosols, refrigerators, air-conditioners, etc.
- The molecules of chlorofluorocarbons in the stratosphere are broken down by ultraviolet radiations and release chlorine atoms. These atoms react with ozone and destroy it.
- Chlorine and bromine atoms in the atmosphere come in contact with ozone and destroy the ozone molecules. One chlorine atom can destroy 100,000 molecules of ozone. It is destroyed more quickly than it is created.
Nitrogenous Compounds
- The nitrogenous compounds such as NO2, NO, N2O are highly responsible for the depletion of the ozone layer.
Polar Stratospheric Clouds (PSCs)
- Nacreous (Mother-of-Pearl) Clouds – Form at very low temperatures. Long, colorful, iridescent clouds (10–100 km long).
- Nitric Acid Clouds – Made of nitric acid + water, not just pure ice.
- Non-iridescent Nacreous-Type Clouds – Same chemistry as nacreous clouds but form slowly → no glow.
- These high altitude clouds form only at very low temperatures and contribute to ozone layer depletion in two ways:
- They provide a surface which converts benign forms of chlorine into reactive, ozone-destroying forms.
- They remove nitrogen compounds that moderate the destructive impact of chlorine.
- In recent years, the atmosphere over the Arctic has been colder than usual, and polar stratospheric clouds have persisted into the spring. As a result, ozone levels have been decreasing.
- CFCs release chlorine in the stratosphere.
- Chlorine stored in inactive forms: HCl (Hydrogen Chloride), ClONO₂ (Chlorine Nitrate)
- On the surfaces of Polar Stratospheric Clouds, chemical reactions convert inactive chlorine → active chlorine (Cl / ClO).
- Example: HCl + ClONO₂ → releases active chlorine faster only in presence of Polar Stratospheric Clouds.
- Active chlorine destroys ozone (O₃) rapidly when sunlight returns in spring.
Ozone Depleting Substances (ODSs)
- CFC, Hydrochlorofluorocarbons (HCFCs), Halon, Carbon Tetrachloride, Methyl Bromide, Bromofluoromethane.
Efforts for Ozone layer protection
The Vienna Convention
- For the Protection of the Ozone Layer it is a multilateral environmental agreement signed in 1985 that provided frameworks for international reductions in the production of chlorofluorocarbons due to their contribution to the destruction of the ozone layer.
Montreal Protocol 1987–
- It was designed to reduce the production and consumption of ozone depleting substances in order to reduce their abundance in the atmosphere and thereby protecting the earth’s fragile zone.
- The treaty was opened for signature on September 16, 1987 so World Ozone day is celebrated on 16 September every year.
- 2025 Theme: From science to global action
- Entered into force in 1989.
- Provisions: All member countries have to maintain the production and use of CFC at the level of 1986, in which any increase is prohibited.
The Copenhagen Amendment (1992)
- This significantly accelerated the phaseout of Ozone depleting substances and incorporated hydrochlorofluorocarbons (HCFC) phaseout for developed countries, beginning in 2004.
- Under this agreement, CFCs, halons, carbon tetrachloride, and methyl chloroform were targeted for complete phaseout in 1996 in developed countries.
- In addition, consumption of methyl bromide was capped at 1991 levels.
Kigali Amendment
- The Kigali Amendment to the Montreal Protocol is an international agreement aimed at the gradual phase out of consumption of hydrofluorocarbons (HFCs).
- It is a legally binding agreement.
- HFCs are therefore thousands of times more heat-trapping than CO2.
- Eliminating emissions of these gases could significantly lower the effects of global warming and avoid a full 0.5 degree Celsius of warming above pre-industrial levels by the end of the century.
| Group | Countries included | Start from | Level | Target of reduction |
| Group 1 | Developed countries | 2019 | 2011-13 | 85 percent by 2036 |
| Group 2 | Developing countries, including China and African nations | 2024 | 2020-22 | 80 percent by 2045 |
| Group 3 | Include India, Pakistan, Iran, Iraq and Arab Gulf states | 2028 | 2024-26 | 85 percent by 2047 |
Environment Pollution
Pollution is defined as the addition or excessive addition of certain materials to the physical environment (water, air and lands), making it less fit or unfit for life.
Types of pollutants
- Primary pollutants: These persist in the form in which they are added to the environment e.g. Carbon monoxide (CO), Oxides of nitrogen (NOx, NO), Sulfur oxides (SOx), Hydrocarbons, Particulate matter (dust, ash, salt particles), Methane, Carbon dioxide
- Secondary Pollutants: These are formed by interaction among the primary pollutants. For example, Peroxyacetyl nitrate (PAN) is formed by the interaction of nitrogen oxides and hydrocarbons, Ozone (O₃), Photochemical smog, Formaldehyde (HCHO), Sulphuric acid (H₂SO₄)
- Quantitative Pollutants: These occur in nature and become pollutants when their concentration reaches beyond a threshold level. E.g. Carbon dioxide, Nitrogen oxide.
- Qualitative Pollutants: These do not occur in nature and are man-made. E.g. fungicides, herbicides, DDT etc.
- Biodegradable Pollutants: Waste products, which are degraded by microbial action. E.g. sewage.
- Non-biodegradable Pollutants: Pollutants, which are not decomposed by microbial action. E.g. plastics, glass, DDT, salts of heavy metals, radioactive substances etc.
Air pollution
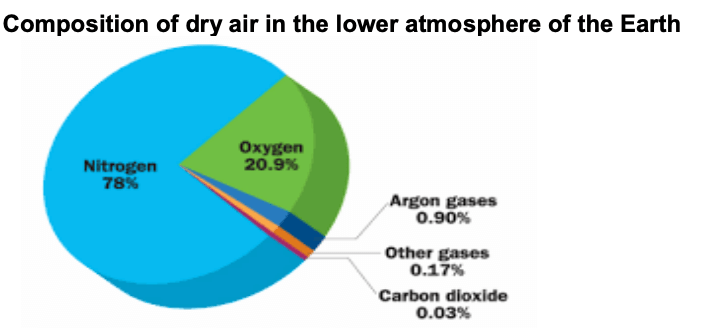
Air consists of a mixture of gases. By volume, about 78% of this mixture is nitrogen and about 21% is oxygen. Carbon dioxide, argon, methane, ozone and water vapour are also present in very small quantities.
- When air is contaminated by unwanted substances which have a harmful effect on both the living and the non-living, it is referred to as air pollution.
- The substances which contaminate the air are called air pollutants. Sometimes, such substances may come from natural
- Sources like smoke and dust arising from forest fires or volcanic eruptions. Pollutants are also added to the atmosphere by certain human activities. The sources of air pollutants are factories, power plants, automobile exhausts and burning of firewood and dung cakes.
Major air pollutants and their sources
| Pollutant | Sources | Effects |
| Carbon monoxide (CO) | Produced by incomplete burning of carbon-based fuels (petrol, diesel, wood). Also from combustion of natural/synthetic products like cigarettes. | Lowers oxygen entering blood, slows cells, causes confusion and epilepsy. |
| Carbon dioxide (CO₂) | Emitted as a result of human activities such as burning of coal, oil, and natural gas. | Principal greenhouse gas contributing to global warming. |
| Chlorofluorocarbons (CFCs) | Released from air-conditioning systems and refrigerators. | Rise to stratosphere, reduce ozone layer that protects earth from harmful UV rays. |
| Lead | Present in petrol, diesel, lead batteries, paints, hair dye products, etc. | Causes nervous system damage, digestive problems, and may cause cancer. Particularly children affected. |
| Ozone | Naturally occurs in the upper atmosphere. Ground level formed from vehicles and industries. | In the stratosphere: shields earth from harmful UV rays. At ground level: toxic pollutant, causes eye irritation, lowers resistance to cold and pneumonia. |
| Nitrogen oxides (NOx) | Produced from burning fuels (petrol, diesel, coal). | Causes smog, acid rain, makes children more susceptible to respiratory diseases in winter. |
| Suspended Particulate Matter (SPM) | Consists of solids in air: smoke, dust, vapour; remain suspended for long. | Reduces visibility, finer particles lodge in lungs, cause lung damage and respiratory problems. |
| Sulphur dioxide (SO₂) | Produced from burning coal (thermal power plants), industrial processes (paper production, metal smelting). | Major contributor to smog and acid rain, can lead to lung diseases. |
Smog
- Smoke + fog (smoky fog) caused by the burning of large amounts of coal, vehicular emission and industrial fumes (Primary pollutants).
Sulfurous smog
- It is also called “London smog,” (first formed in London).
- It results from a high concentration of sulfur oxides in the air and is caused by the use of sulfur-bearing fossil fuels, particularly coal (Coal was the main source of power in London during the nineteenth century and the effects of its large-scale burning were observed in the early twentieth century).
- This type of smog is aggravated by dampness and a high concentration of suspended particulate matter in the air.
Photochemical smog
- It is also known as “Los Angeles smog”.
- It occurs most prominently in urban areas that have large numbers of automobiles (Nitrogen oxides are the primary emissions).
- Photochemical (summer smog) forms when pollutants such as nitrogen oxides (primary pollutant) and organic compounds (primary pollutants) react together in the presence of SUNLIGHT.
- This process require smoke, fog, nitrogen oxide, hydrocarbons, oxygen, high temperature and UV rays.
- These reacts and make red- brown Smog.
- It is a mixture of (PAN + Ozone + Nitrogen Oxides)
- The major chemical pollutants in Photochemical smog are NO, NO2, volatile organic compounds, Ozone, and PAN (Peroxyacetyl Nitrate). NO2 decreases visibility due to yellowish colour.
Fly ash
- Ash is produced whenever combustion of solid material takes place
- Fly ash is one such residue which rises with the gases into the atmosphere.
- Fly ash particles are oxide sier and consist of silica, alumina, oxides of iron, calcium, and magnesium and toxic heavy metals like lead, arsenic, cobalt, and copper.
- Composition
- Aluminium silicate (in large amounts)
- Silicon dioxide
- Calcium oxide (CaO)
Control measures:
- Destroying the pollutants by thermal or catalytic combustion
- Conversion of the pollutants to a less toxic form
- Control of particulate matter: Two types of devices arresters and scrubbers are used to remove particulate pollutants from air.
- Arresters: These are used to separate particulate matters from contaminated air.
- Scrubbers: These are used to clean air from both dusts and gases by passing it through a dry or wet packing material
- Control of Gaseous Pollutants: The gaseous pollutants can be controlled through the techniques of combustion, absorption and adsorption.
- Control of Automobile Exhaust
- Use of efficient engines (e.g. multipoint fuel injection engine).
- Catalytic converter filters in the vehicles can convert nitrogen oxide to nitrogen and reduce the potential hazards of NOx.
- Use of good quality automobile fuels
- Use of lead free petrol.
- Use of compressed natural gas (CNG).
- Use of electric vehicles.
Policy measures
National Air Quality Monitoring Programme
- In India, the Central Pollution Control Board (CPCB) has been executing a nationwide programme of ambient air quality monitoring known as National Air Quality Monitoring Programme (NAMP).
National Ambient Air Quality Standards (NAAQS)
- National Ambient Air Quality Standards (NAAQS) were natified in the year 1982; duly revised in 1994 based on health criteria and land uses.
- The country has a network of quality monitoring stations covering 516 cities
- The national ambient air quality notified for 12 parameters = PM 10, PM 2.5, NO2, SO2, CO, Ozone, Ammonia, Lead, Nickel, Arsenic, Benzopyrene, and Benzene.
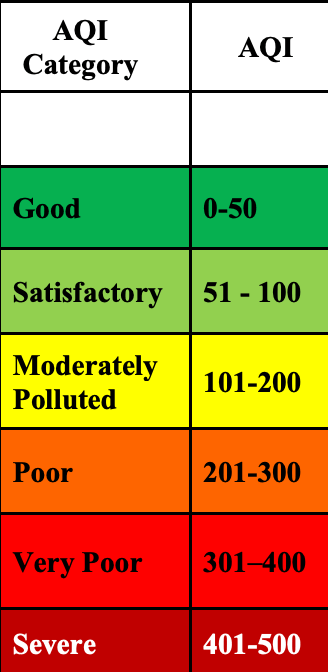
National Air Quality Index
- Air Quality Index is a tool for effective communication of air quality status to people in terms, which are easy to understand.
- There are six AQI categories, namely Good, Satisfactory, Moderately polluted, Poor, Very Poor, and Severe.
- Each of these categories is decided based on ambient concentration values of air pollutants and their likely health impacts (known as health breakpoints).
- AQI sub-index and health breakpoints are evolved for eight pollutants
- (PM 10, PM 2.5, NO2, SO2 ,CO, Ozone, NH3 and Pb).
Categories | Score | Colour | Impact on Human Health | ||||||||||||||||||
 |
|
|
|
National clean air programme
- It was launched by the Ministry of Environment, Forest and Climate Change (MoEF&CC) in January 2019
- Objective – Improving air quality in 131 non-attainment and million Plus Cities/Urban Agglomerations across 24 States/UTs, by engaging all relevant stakeholders.
- NCAP aims for a reduction of 20-30% in PM10 concentrations by 2024-25 compared to the baseline year of 2017-18.
- The target has been revised to achieve up to a 40% reduction in PM10 levels or to meet national standards (60 µg/m³) by 2025-26.
- PRANA– Portal for Regulation of Air-pollution in Non-Attainment Cities, has been developed as a portal for monitoring implementation of National Clean Air Programme (NCAP) and to track physical as well as financial progress of cities under NCAP.
RajVayu
- To know quality of air Rajasthan state pollution control board, Rajasthan government and UNICEF Rajasthan has launched RajVayu app.
- Air quality of Jaipur, Jodhpur and Udaipur available.
- Pollutants -PM 10, PM 2.5, CO, ozone, NO2, SO2
- Other app – Drishti app (To handle noise pollution cases)
Central pollution control board
- The Central Pollution Control Board (CPCB), statutory organisation, was constituted in September, 1974 under the Water (Prevention and Control of Pollution) Act, 1974. Further, CPCB was entrusted with the powers and functions under the Air (Prevention and Control of Pollution) Act, 1981.
- It serves as a field formation and also provides technical services to the Ministry of Environment and Forests of the provisions of the Environment (Protection) Act, 1986. Principal Functions of the CPCB, as spelt out in the Water (Prevention and Control of Pollution) Act, 1974, and the Air (Prevention and Control of Pollution) Act, 1981,
- (i) to promote cleanliness of streams and wells in different areas of the States by prevention, control and abatement of water pollution, and
- (ii) to improve the quality of air and to prevent, control or abate air pollution in the country.
National Green Tribunal (NGT)
- It is an Indian statutory body established in 2010 under the National Green Tribunal Act.
- NGT was established for effective and expeditious disposal of cases relating to environment protection.
- The Tribunal is mandated to make and endeavour for disposal of applications or appeals finally within 6 months of filing of the same.
- Chairperson of the National Green Tribunal (NGT) is appointed by the Central Government in consultation with the Chief Justice of India.
Standards
Noise standards
| Category of area | Day time | Night time |
| Industrial | 75 decibel | 70 decibel |
| commercial | 65 decibel | 55 decibel |
| residential | 55 decibel | 45 decibel |
| Silent Zone | 50 decibel | 40 decibel |
Notified under noise pollution rules, 2000.
Water pollution
- Whenever harmful substances such as sewage, toxic chemicals, silt, etc., get mixed with water, the water becomes polluted. The substances that pollute water are called water pollutants.
- Towns and cities, through which the river flows, throw large quantities of garbage, untreated sewage, dead bodies, and many other harmful things, directly into the river. In fact the river is ‘dead’ at many places where the pollution levels are so high that aquatic life cannot survive.
- Sewage, agricultural chemicals and industrial waste are some of the major contaminants of water.
- Water pollution is not only confined to surface water, but it has also spread to ground water, sea and ocean.
Some important terms
Dissolved Oxygen (DO)
- Amount of oxygen dissolved in water.
- Essential for survival of fish and other aquatic organisms.
- DO decreases when organic/inorganic wastes increase because more oxygen is used in decomposition.
- DO Level – Meaning
- Below 8 mg/L – Contaminated water
- Below 4 mg/L – Highly polluted water
Biological Oxygen Demand (BOD)
- Oxygen required by bacteria to decompose organic waste in water.
- Higher BOD = More pollution + Lower DO
- Measured in mg O₂/L.
- Measures only biodegradable organic matter. Not suitable when non-biodegradable pollutants are high.
Chemical Oxygen Demand (COD)
- Measures total oxygen needed to oxidise both biodegradable and non-biodegradable organic matter using chemicals.
- Better indicator than BOD because it covers all pollutants, not just biodegradable ones.
Primary water quality criteria for bathing water
- Criteria
- Fecal Coliform MPN/100 ml: 500 (desirable) – 2500 (Maximum Permissible)
- Fecal Streptococci MPN/100 ml: 100 (desirable) – 500 (Maximum Permissible)
- pH: Between 6.5-8.5
- Dissolved Oxygen: 5 mg/1 or more
- Biochemical Oxygen demand 3 day, 27°C: 3 mg/1 or less
Control Measures of Water Pollution
- Riparian Buffers – Maintain vegetation along riverbanks to filter pollutants.
- Treatment of Sewage & Industrial Effluents – Must be treated before discharge into water bodies.
- Cooling of Thermal Wastewater – Hot water from power plants should be cooled before release.
- Ban Domestic Washing in Water Sources – No bathing, washing clothes, utensils in drinking water bodies.
- Limit Chemical Fertilizers & Pesticides – Prevent runoff and chemical contamination.
- Promote Organic Farming – Use animal waste as natural manure.
- Use Aquatic Plants (Water Hyacinth) – Absorbs toxic substances and heavy metals from water.
- Cleaning Oil Spills – Use Bregoli (paper industry by-product) to remove oil from water.
- SPCBs/PCCs enforce effluent standards – Action taken against industries to meet discharge norms.
- Financial support for CETPs – Helps clusters of small industries treat wastewater collectively.
- Zero Liquid Discharge (ZLD) directives – Industries required to recycle and reuse all wastewater.
- Legal directives to industries – Section 5 – Environment Protection Act (1986), Section 18(1)(b) – Water Act (1974)
- Conservation of Lakes and Wetlands – Earlier through NLCP & NWCP. Since 2013, merged into NPCA (National Plan for Conservation of Aquatic Ecosystems).
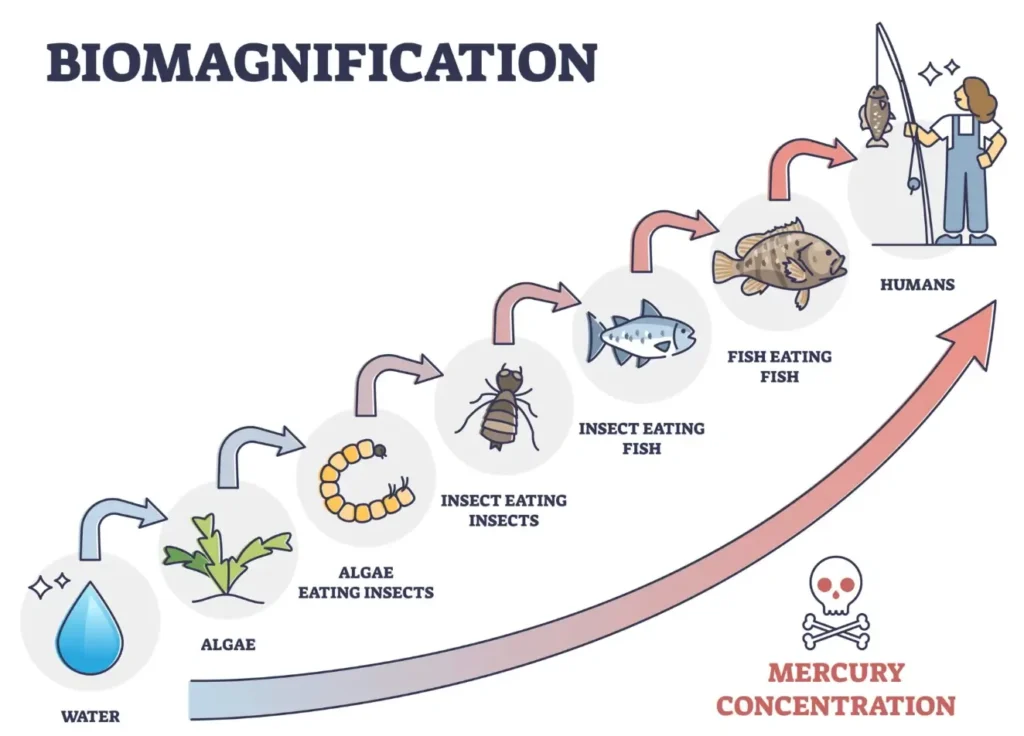
- Biomagnification is the increasing concentration of toxic substances at higher trophic levels in a food chain. It mainly involves Persistent Organic Pollutants (POPs)—chemicals that do not break down easily and accumulate in fatty tissues of organisms.
- How it starts: Pesticides and chemicals enter soil and water → absorbed by plants → eaten by animals → passed through the food chain.
- POPs are non-biodegradable, so they keep accumulating instead of getting excreted or decomposed.
- Examples– DDT (pesticide), Aldrin & Dieldrin(insecticides), Endosulfan, Furans & Dioxins, Hexachlorobenzene (HCB) fungicide
- Humans, being at the top trophic level, end up with the highest concentration.
Effects of Biomagnification
| Impact on WildlifeAnimals at higher trophic levels (birds of prey, large fish, marine mammals) are most affected.Causes reduced fertility, weakened immunity, and behavioural changes. | Impact on HumansHarmful chemicals (e.g., mercury, pesticides) enter the body through food.Can cause neurological problems, especially in infants and children. |
Bioaccumulation
- Bioaccumulation is the build-up of harmful chemicals in an organism over time when absorption from air, water, soil, or food is faster than the body’s ability to excrete them.
- These chemicals (like heavy metals, pesticides) collect in tissues—especially fat—and can become toxic.
- Features – Persistent chemicals accumulate more because they don’t break down easily. Lipophilic (fat-loving) chemicals store in body fat and stay longer. Slow metabolism/excretion → more accumulation (e.g., large fish bioaccumulate more than small fish).
Stockholm Agreement
- It is a global treaty to protect human health and the environment from POPs.
- It was opened for signature in 2001 in Stockholm (Sweden) and became effective on 17 May 2004.
- India ratified the Stockholm Convention in 2006 as per Article 25(4).
- The convention calls to ban the dirty dozen(12) chemicals (key POPs).
- The convention listed twelve chemicals in three categories:
- Eight pesticides (Aldrin, Chlordane, DDT, Dieldrin, Endrin, Heptachlor, Mirex and Toxaphene)
- Two industrial chemicals (poly chlorinated biphenyls and hexachlorobenzene)
- Two (dioxins and furans).
Rotterdam Convention
- An international treaty adopted in 1998 (Rotterdam, Netherlands) and came into force in 2004 to regulate the trade of hazardous chemicals.
- Objective – To ensure shared responsibility, safe and informed trade of hazardous chemicals so that countries can protect human health and the environment.
- Pesticides and industrial chemicals banned or severely restricted by countries
- Chemicals listed under the Prior Informed Consent (PIC) procedure. Export of a listed hazardous chemical is allowed only after the importing country gives consent.
Eutrophication
- Eutrophication is the process by which a water body becomes overly enriched with nutrients — primarily nitrogen and phosphorus — leading to excessive growth of algae and aquatic plants.
- The excessive growth (or bloom) of algae and plankton in a water body are indicators of this process.
- Types of Eutrophication
- Natural Eutrophication: A slow, centuries-long process where water bodies accumulate nutrients naturally due to sedimentation, weathering, etc.
- Cultural (Artificial) Eutrophication: Rapid nutrient enrichment due to human activities like agriculture, urban waste discharge, and industrial pollution.
- Process of Eutrophication
- Nutrient Input – Excess nitrates & phosphates enter water from fertilizers, sewage, and industrial waste.
- Algal Bloom – Extra nutrients act as fertilizer → rapid growth of algae and phytoplankton on the surface.
- Sunlight Blocked – Thick algae cover prevents sunlight from reaching underwater plants.
- Death of Plants & Algae – Submerged plants die due to lack of light; algae die after short life cycles.
- Decomposition – Dead plants & algae are decomposed by bacteria, which consume dissolved oxygen.
- Oxygen Depletion (Hypoxia) – High bacterial activity increases BOD → oxygen levels drop.
- Death of Aquatic Life / Dead Zones – Fish and other organisms die due to lack of oxygen, creating lifeless dead zones.
Marine pollution
- Introduction of harmful substances or energy into the marine environment by human activities, leading to hazards for marine life, risks to human health and obstruction of marine activities and deterioration of water quality.
Reasons
- Oil Spills, industrial runoff, pesticides, and heavy metals create toxic conditions and dead zones, Industrial discharge alters water temperature, affecting aquatic ecosystems.
- Air pollutants like acid rain, heavy metals, and microplastics settle into seas.
- Plastic Pollution: Huge quantities of plastics enter the seas, choking marine animals and birds.
- Sewage & Waste Disposal: Nutrient loading causes algal blooms and oxygen depletion.
Preventive Measures for Marine Plastic Pollution
- Sustainable Development Goal 14: Life below water
- UNCLOS (1982): Mandates signatories, including India, to adopt measures to prevent, reduce, and control marine pollution.
- Plastic Waste Management (Amendment) Rules, 2022: Introduces Extended Producer Responsibility (EPR) for plastic packaging, making producers accountable for collection and recycling.
- Single-Use Plastic Ban (2022): Prohibits select single-use plastic items like cutlery, straws, and carry bags below 75 microns thickness.
Blue Flag Tag
- The Blue Flag is an international eco-label awarded to beaches, marinas, and sustainable boating tourism operators.
- It is administered by the Foundation for Environmental Education (FEE), headquartered in Copenhagen, Denmark.
- Recognized globally as a symbol of cleanliness, safety, and environmental sustainability.
- Rushikonda Beach in Visakhapatnam wins back the Blue Flag tag.
- India currently has 13 beaches with Blue Flag certification.
- To earn the Blue Flag, a beach/marina must meet 33 strict criteria across four main categories:
- Environmental Education and Information
- Water Quality
- Environmental Management
- Safety and Services
Plastic pollution
- Plastic pollution refers to the accumulation of plastic materials in the environment, adversely affecting ecosystems, wildlife, and human health.
- Plastics, derived from petrochemicals, are non-biodegradable, breaking down into smaller fragments (microplastics) that persist for centuries.
- India’s Plastic Waste Challenge
- Scale: In India, plastic waste generation is estimated at 9.4 million MT annually with only 50% of it being collected and processed, mostly via informal sectors. (Source: World Economic Forum)
- Mismanagement: 77% of urban waste goes to open landfills; 5.8 million tonnes burned yearly, releasing 3.5 million tonnes as debris into land, air, and water. (Source: Times of India)
- Microplastics are small pieces of plastics, usually smaller than 5 mm. They are persistent, very mobile and hard to remove from nature.
Sixth round of negotiations
- August 2025 saw the sixth round of UN negotiations to deliver the first legally binding global treaty on plastic pollution concluded in Geneva with no agreement.
- Major disagreements remain on whether to limit plastic production itself or just manage waste.
Key Facts
- Global Picture – World produces 430+ MT plastic/year, 2/3 are short-lived items.
- Environmental Impact – Plastics contribute 3.4% of global GHG emissions (2019), microplastics entering food systems.
India’s efforts
- World Environment Day 2025 (India) – Theme: “One Nation, One Mission: End Plastic Pollution”
- Plastic as a material is useful, but improper disposal is the main cause of pollution.
- Citizens urged to avoid single-use plastics and stop using plastic carry bags below 120 microns
- Extended Producer Responsibility (EPR)
- EPR guidelines support: Circular economy, Environmentally sound plastic waste management
- Emphasis on Mission LiFE principles & recycling to save natural resources
- Plastic waste, especially single-use plastic, poses serious threats to ecosystems and public health. In urban India, where plastic makes up to 46% of dry waste, rapid urbanization has worsened the problem.
- India has responded with stricter regulations—banning thin plastic bags since 1999 and prohibiting key single-use items from July 2022.
- SBM-U and its 2.0 phase emphasizes sustainable plastic waste management through reduction, segregation, and eco-friendly alternatives.
| Popular acts | Enacted in |
| Water (Prevention & Control of Pollution) Act | 1974 |
| Air (Prevention & Control of Pollution) Act | 1981 |
| Environment (Protection) Act | 1986 |
| Ozone Depleting Substances (Regulation) Rules | 2000 |
| Wildlife protection act | 1972 |
| Forest conservation act | 1980 |
| Biodiversity conservation act | 2002 |
| Plastic Waste Management Rules, (Amendment – 2022) | 2016 |
| E-Waste (Management) RulesRevised rules in force since 1st April, 2023) | 2016 |
| Environment Protection (Management of Contaminated Sites) Rules | 2025 |
Reports
EnviStats India 2025
- EnviStats India 2025 is the 8th edition of the publication released by the Ministry of Statistics & Programme Implementation (MoSPI).
- Key Highlights
- Power & Energy
- Thermal Power Generation: 2013–14: 7,92,053 GWh – 2023–24: 13,26,549 GWh → Significant increase despite shift to renewables.
- Renewable Energy Generation: 2013–14: 65,520 GWh – 2023–24: 2,25,835 GWh → Almost 3.5× increase.
- Temperature Trends (2001–2024)
- Annual Mean Temperature: 2001: 25.05°C → 2024: 25.74°C
- Minimum Temperature: 2001: 19.32°C → 2024: 20.24°C
- Maximum Temperature: 2001: 30.78°C → 2024: 31.25°C
- Clear warming trend reflected in all temperature parameters.
- Rainfall Trends (2001–2024) – Shows year-to-year variability, heavily influenced by monsoon. No long-term increasing or decreasing trend detected.
- India’s Faunal Diversity – India hosts ~6.25% of global faunal diversity. Species found in India: 1,04,561
4th Biennial Update Report (BUR-4)
- India submitted its 4th Biennial Update Report (BUR-4) to the UNFCCC on 30th December 2024. The report shows a 7.93% reduction in total GHG emissions in 2020 with respect to 2019.
IPCC Sixth Assessment Report (AR6)
Key Findings
- Unprecedented Global Warming – Human-induced global warming has reached 1.1°C above pre-industrial levels.
- This increase has triggered climate changes never seen in recent human history, including: Sea level rise, Extreme heatwaves, Intense cyclones, Glacial melt, Disappearance of sea ice.
- Every additional 0.1°C rise dramatically increases climate risks.
- Global Temperature May Cross 1.5°C Soon
- More than 50% chance that warming will cross 1.5°C between 2021–2040.
- Under high-emission scenarios, the threshold may be crossed much earlier: Between 2018 and 2037. This will make limiting warming to 1.5°C extremely challenging.
- Adaptation: 170+ countries now include adaptation in climate policies. But adaptation is slow
- Finance is the biggest barrier, especially for developing nations.
- Required actions: Retire old fossil fuel plants, Cancel new coal/oil/gas projects, Avoid locking-in carbon-intensive infrastructure
- Aim: Net-zero, climate-resilient future.
Important Environment & Climate Reports
| Report Name | Released By / Organisation |
| Global Environment Outlook (GEO) Report | UNEP |
| Living Planet Report | WWF |
| State of World Climate Report / State of Global Climate Report | WMO (World Meteorological Organization) |
| Red List of Threatened Species | IUCN |
| World Air Quality Report | IQAir (Swiss Company) |
| CO₂ Emissions Report | International Energy Agency (IEA) |
| Emission Gap Report | UNEP |
| Adaptation Gap Report | UNEP |
| Protected Planet Report (Biennial) | IUCN + UNEP |
| World Heritage Outlook | IUCN |
| Sustainable Use of Wild Species Report | IPBES Intergovernmental Science-Policy Platform on Biodiversity and Ecosystem Services |
| World Heritage Glaciers: Sentinels of Climate Change | IUCN + UNESCO |
| SDG Report | UN – SDSN (Sustainable Development Solutions Network) |
| Global Methane Tracker | IEA |
| State of World Forests Report (Biennial) | FAO |
| Global Risks Report | World Economic Forum (WEF) |
Cycles
Carbon cycle
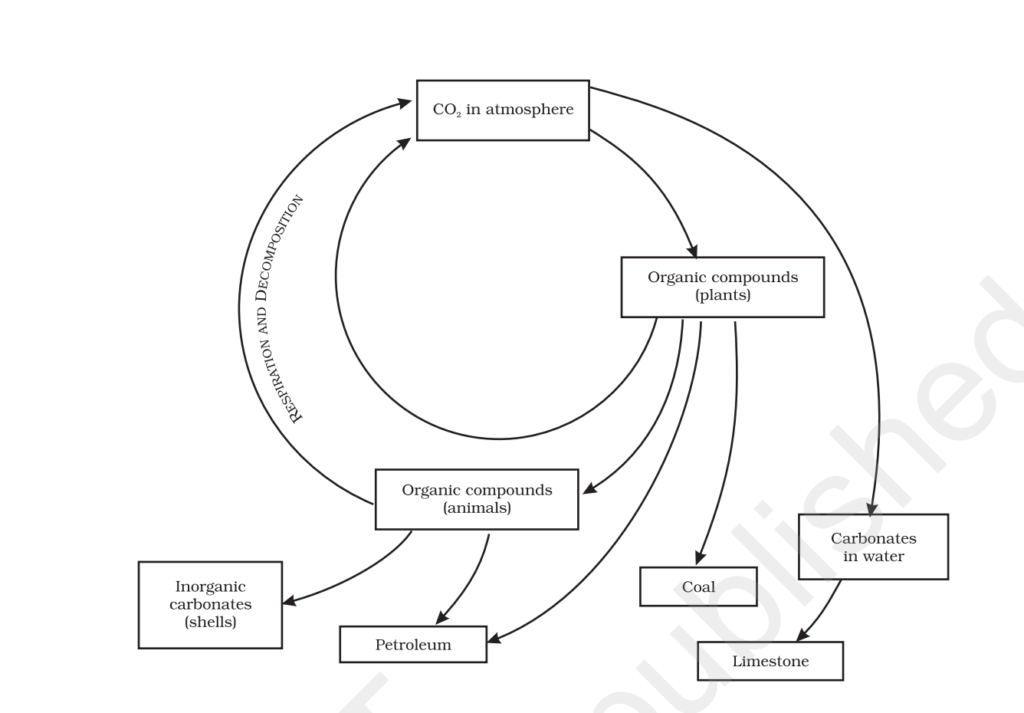
- Carbon is a minor constituent of the atmosphere as compared to oxygen and nitrogen. However, without carbon dioxide life could not exist, because it is vital for the production of carbohydrates through phots synthesis by plants.
- Carbon is present in the atmosphere, mainly in the form of carbon dioxide (CD)
- Carbon cycle involves a continuous exchange of carbon between the atmosphere and organisms. It is usually a short term cycle.
- Carbon from the atmosphere moves to green plants by the process of photosynthesis.
- Through the process of respiration it reaches animals.
- Decomposition of dead organic matter.
- Returns back to the atmosphere (Inorganic carbon in soil)
- Carbon also enters a long term cycle. It accumulates as undecomposed organic matter in the peaty layers of marshy soil or as insoluble carbonates in the sediments of aquatic systems, where it remains stored for long periods before being released.
- In deep oceans such carbon can remained buried for millions of years till geological movement may lift these rocks above sea level. These rocks may be exposed to erosion, releasing their carbon dioxide, carbonates and bicarbonates into streams and rivers.
Nitrogen cycle
Most life-forms cannot use nitrogen directly from the atmosphere.
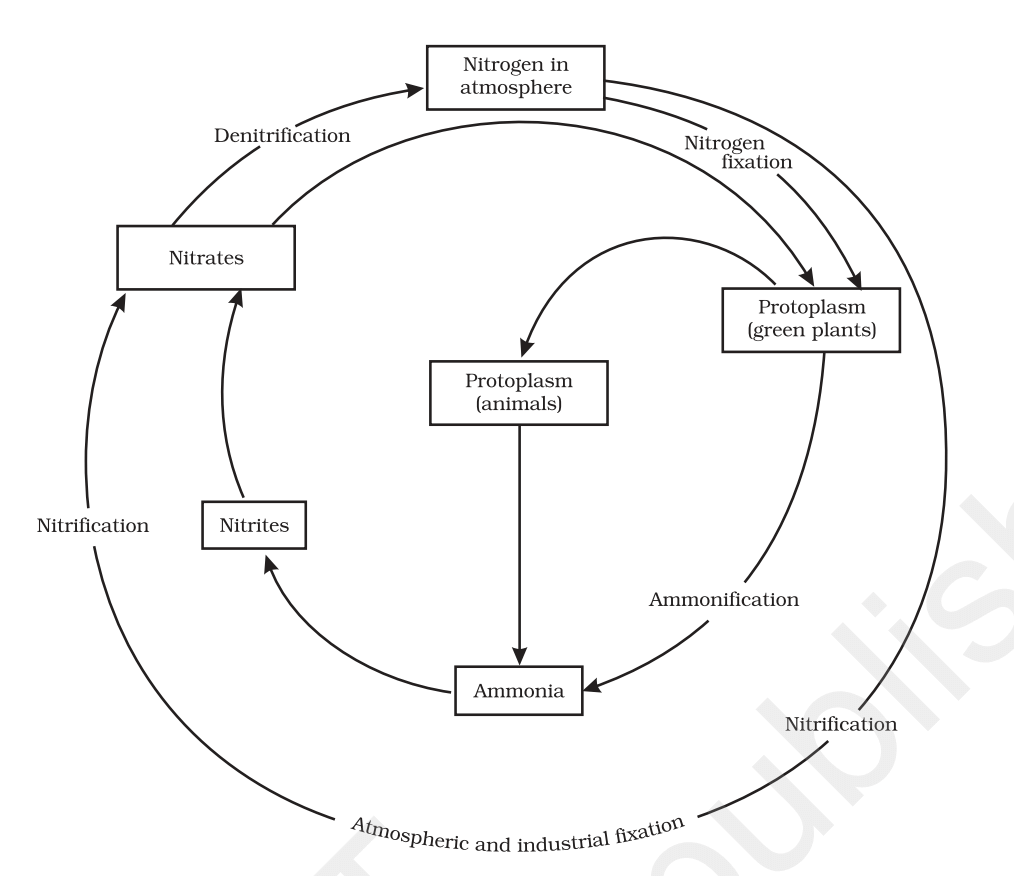
- Nitrogen Fixation – Converting atmospheric nitrogen into usable forms.
- Done by bacteria: Free-living bacteria.
- Symbiotic bacteria in legume root nodules (pulses).
- Converts nitrogen → nitrates & nitrites.
- Lightning also converts nitrogen into oxides, which dissolve in rainwater and form usable compounds.
- Assimilation (Use by Plants & Animals)
- Plants absorb nitrates/nitrites to make amino acids, proteins, and vitamins.
- Animals eat plants → get nitrogen compounds for their body.
- Ammonification & Nitrification
- When plants/animals die → decomposer bacteria convert organic nitrogen back into ammonia, nitrites, nitrates.
- Denitrification
- Special bacteria (common examples including genera like Pseudomonas, Thiobacillus, Bacillus, Micrococcus, Alcaligenes, and Clostridium) convert nitrates/nitrites → nitrogen gas (N₂).
- Returns nitrogen to the atmosphere → completes the cycle.
Types of Nitrogen-Fixing Bacteria
- Rhizobium: Symbiotic bacteria that form nodules on legume roots (peas, beans, soybeans).
- Azotobacter: Free-living, aerobic bacteria in soil.
- Clostridium: Free-living, anaerobic bacteria.
- Cyanobacteria: Photosynthetic bacteria, like Nostoc and Anabaena, found in aquatic environments.
- Frankia: Forms symbiotic relationships with non-leguminous plants (e.g. alder).
- Azospirillum: Free-living, associates with grasses
Ecological terms
- Carbon Footprint – The annual per-capita carbon emissions of a country measured in tonnes of CO₂-equivalent.
- Drawdown – The point at which atmospheric greenhouse-gas concentrations stop rising and begin to decline
- Tipping Point – A critical threshold beyond which small perturbations can trigger large, potentially irreversible climate/system changes.
- Carbon Diet – Reducing greenhouse-gas emissions through efficiency, fuel-switching, and behavior change without lowering the standard of living.
- Earth Hour – A global event organized by WWF (not IUCN). Held annually on the last Saturday of March. A global movement where people, communities, and businesses turn off non-essential lights for one hour (8:30-9:30 PM local time).
- Carbon Accounting – The process of calculating and tracking greenhouse gas emissions. Helps organizations/individuals measure their carbon footprint and plan mitigation strategies.
- Ecomark – An initiative to label environmentally friendly products. Launched by the Bureau of Indian Standards (BIS), India.
- Greenwashing – Conveying misleading information to make a product/company appear environmentally friendly.
- Greenwishing – Coined by Duncan Austin (2019 essay); expressing intent to be eco-friendly without concrete action.
- Green hushing – Companies deliberately stay quiet about their climate strategies to avoid scrutiny.
- Blue Washing – A deceptive marketing tactic making consumers believe a company promotes sustainability in food systems and water conservation.
- Wish-cycling is the act of putting a non-recyclable item in the recycling bin with the hope it will be recycled.
- Rewilding – A conservation method that lets nature take its course by reestablishing natural ecosystems and native species.
- Keeling Curve – Graph depicts the continuous increase in atmospheric carbon dioxide concentrations measured at Mauna Loa Observatory in Hawaii since the 1950s.
- E-20 Fuel – A blend of 80% petrol + 20% ethanol. Government target: Raise ethanol-blended petrol to 30% by 2029–30.
- Carbon Dioxide Index – It is a measure or indicator that tracks the concentration of carbon dioxide (CO₂) in the atmosphere over time. This index helps to monitor trends of CO₂ emissions and their role in climate change.
- Cloudburst – Rainfall of 10 cm or more in an hour over a roughly 10 km x 10-km area is classified as a cloudburst event.
- Biomagnification – The process in which the concentration of toxic substances increases as they move up the food chain. These harmful substances, such as pesticides, heavy metals, and chemicals, accumulate at progressively higher levels in organisms, especially apex predators.
- Bioaccumulation – The process by which organisms absorb chemicals from their environment, including air, water, soil, or through their diet. When intake exceeds the organism’s ability to excrete these chemicals, they accumulate in the body.
- Ecologically Sensitive Zones
- They are notified by the Ministry of Environment , Forests and Climate Change under the Environment (Protection) Act, 1986 (National Wildlife Action Plan, 2002-2016).
- Land within 10 km of the boundaries of national parks and wildlife sanctuaries is to be notified as eco-fragile zones or Eco-Sensitive Zones (ESZ).
- They help in Insitu conservation.
- The purpose of an Eco-Sensitive Zone (ESZ) is to regulate and manage human activities around protected areas to minimize negative environmental impacts, not to prohibit all activities.
- Environment Impact assessment –
- Collection of data on existing environmental conditions before the project starts
- The concept of EIA emerged in the 1960s and 1970s as a response to growing concerns about the environmental impacts of large-scale development projects.
- On 27 January 1994, the Union Ministry of Environment and Forests, Government of India issued the first EIA notification.
- The devastating effects of projects such as the construction of dams, highways, and industrial facilities on ecosystems and communities prompted the need for a systematic approach to assess and mitigate these impacts.
- EIA Notification, issued under the Environment (Protection) Act 1986, outlines the process and requirements for conducting an EIA for various categories of projects.
- The notification categorizes projects into categories: A and B based on their potential environmental impacts and clearance by Central/State Government.
- Category A projects require environmental approval and do not undergo the screening procedure while Category B projects go through a Screening procedure
- Carbon sequestration is the long-term storage of carbon in plants, soils, geologic formations, and the ocean.
- Types of Carbon Sequestration
- Terrestrial – Plants absorb CO₂ by photosynthesis. Stored in soils and biomass (trunks, roots, leaves).
- Geologic – CO₂ stored underground in oil & gas reservoirs, coal seams, saline & shale formations.
- Ocean – Oceans naturally absorb CO₂.
| Ecological terms | Coined by |
| Ecology | Ernst Haeckel, 1869 |
| Ecosystem | A.G Tansley, 1935 |
| Ecological Pyramids | Charles Elton |
| Deep Ecology | Arne Naess |
| Ecological niche | Joseph Grinnell |
| Biodiversity | Walter G. Rosen |
| Environment | Thomas Carlyle |
| Biodiversity hotspots | Norman Mayers |
| Tech ecosystem | Haber |
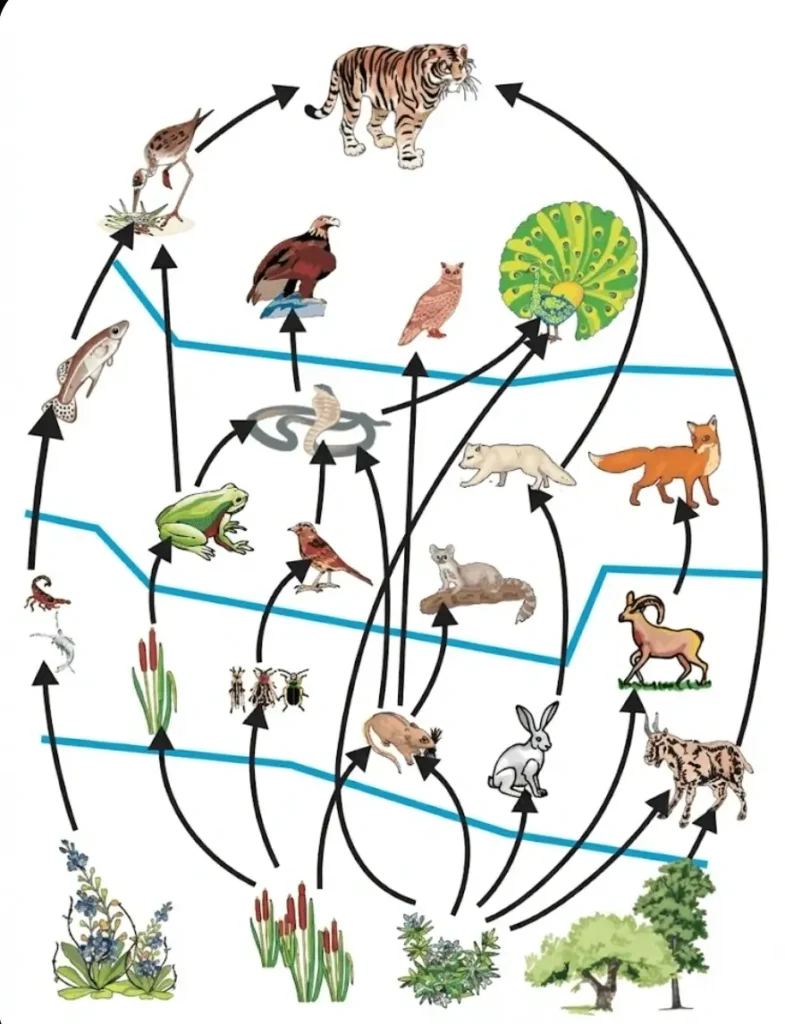
Food chain
- The flow of food and energy from the ecosystem takes place from one organism to another, this flow is called food chain.
- In a food chain, the flow of energy is unidirectional.
- The food chain is formed by primary producers (green plants), first, second and third order consumers and decomposers (fungi, bacteria) together.
- Each level of a food chain is called an energy level or trophic level.
- Types of food chain – There are three types of food chains
Predator or Grazing food chain:
- In this, the chain starts from plants and goes from small animals to big animals.
- Example – Green plants (producers) → Herbivores Insects (primary consumers) → Frogs (secondary consumers) → Snakes (tertiary consumers) → Eagles (supreme consumers or higher carnivores).
- Green plants → Rabbit →Dog →Wolf →Lion
Parasitic food chain
- In this the chain starts from plants and goes from big organisms to small organisms.
- Example
- Tree→ birds →Microorganisms
Saprophytic or detritius food chain–
- In this the chain starts from dead organisms (plants or animals) and goes towards micro organisms (fungi and bacteria). In this the microorganisms obtain food or energy from the organic matter of dead organisms and finally the decomposers eat them.
- Example – Organisms that eat dead organic matter→ White ants→ Ants eating creatures
Note:- Lindemann gave the 10% law of energy in 1942. It states that only 10% of energy in a food chain out of the total energy is transferred from one trophic level to another. The rest of the energy is utilized for other metabolic processes and some are released as heat.
Ecological Pyramid
- When the relationship between the number, biomass and stored energy of primary producers and consumers of different categories (first, second, third and highest category) in any ecosystem is shown in a graphical form, it is called an ecological pyramid.
- Ecological Pyramids were first described by Charles Elton of Britain (1927).
- There are mainly three types of ‘ecological pyramids’ –
- Pyramid of Numbers, Pyramid of Biomass and Pyramid of Energy.
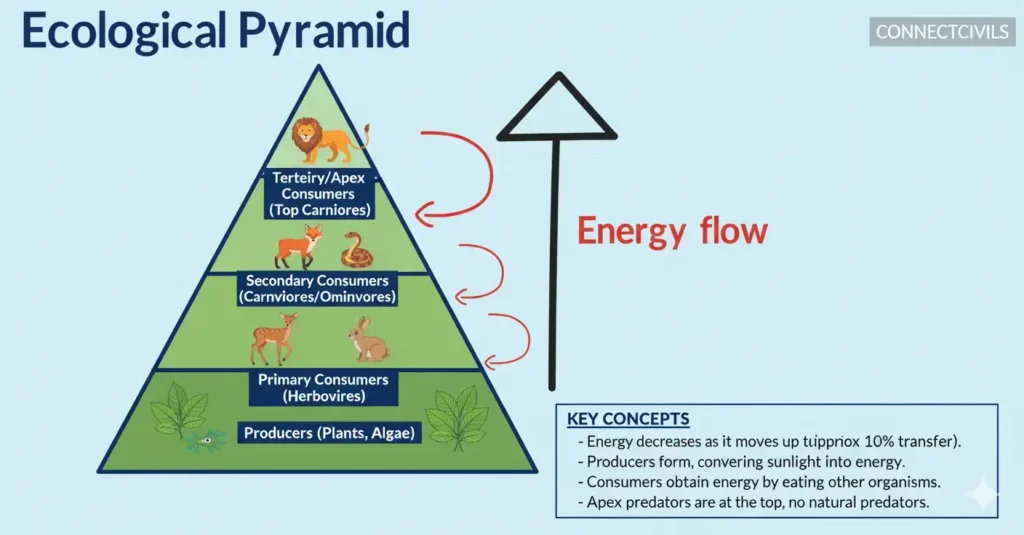
Pyramid of Numbers
- In this pyramid, the number of organisms at the producer and consumer levels is depicted. Generally, this type of pyramid is formed upright, in which the number of producers is the highest while the number of consumers is the lowest.
- Example: Tree ecosystem
- Exception: Some population pyramids are formed inverted. Example: Parasitic food chain.
- This chain starts from a big tree, the number of birds dependent on it is high and the number of parasites feeding on these birds is the highest.
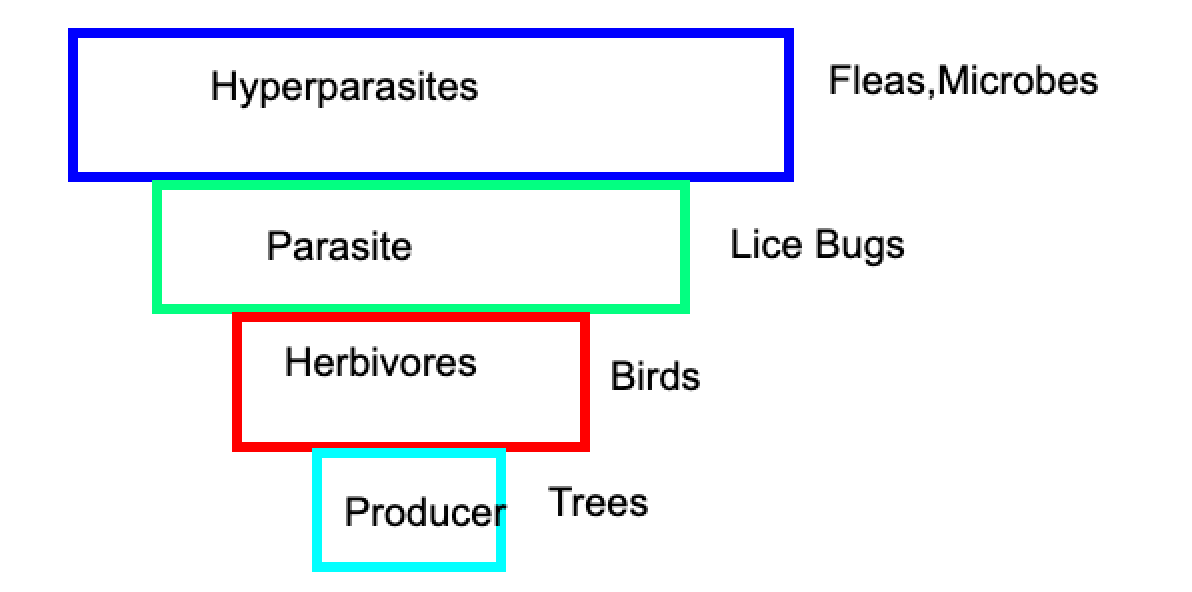
Pyramid of Numbers in a Parasitic Food chain (Inverted)
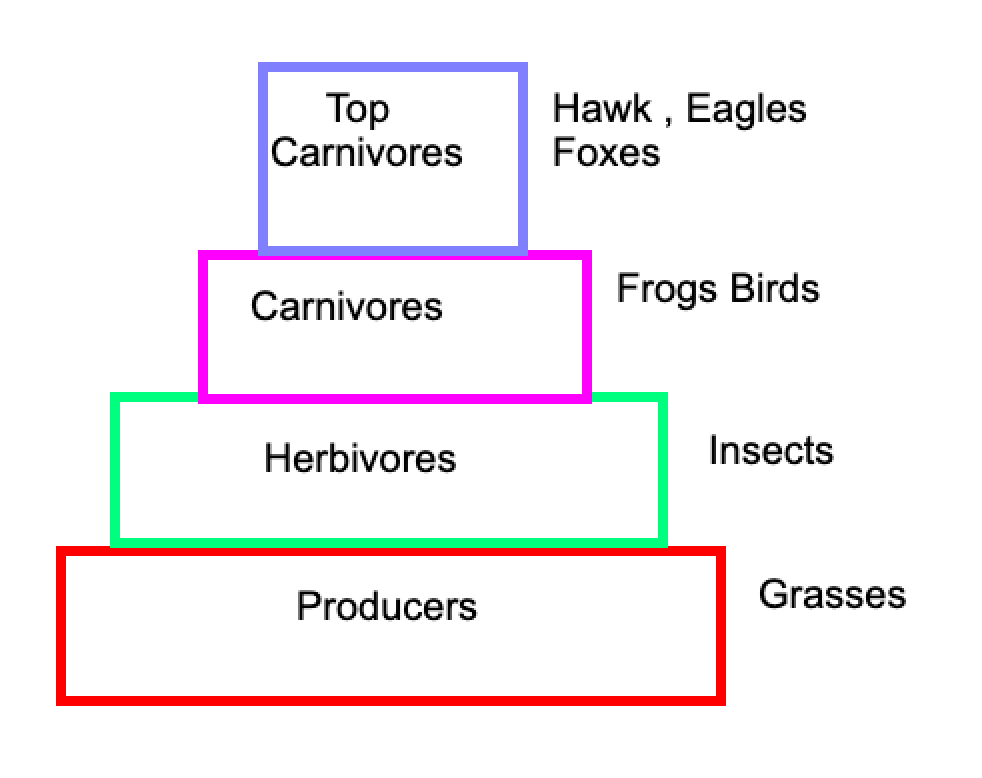
Pyramid of Numbers in Grassland Ecosystem (Upright)
Biomass pyramid
- The total dry weight at each vegetative level of the food chain of an ecosystem is called biomass.
- Biomass pyramids can be both upright and inverted. For example, biomass pyramids of forest and grassland ecosystems are upright.
- On the contrary, in aquatic ecosystems, the biomass pyramid is often inverted. Although primary producers such as phytoplankton and diatoms are very numerous their standing biomass at any given time is lower than that of the higher trophic levels because of their rapid turnover rate.
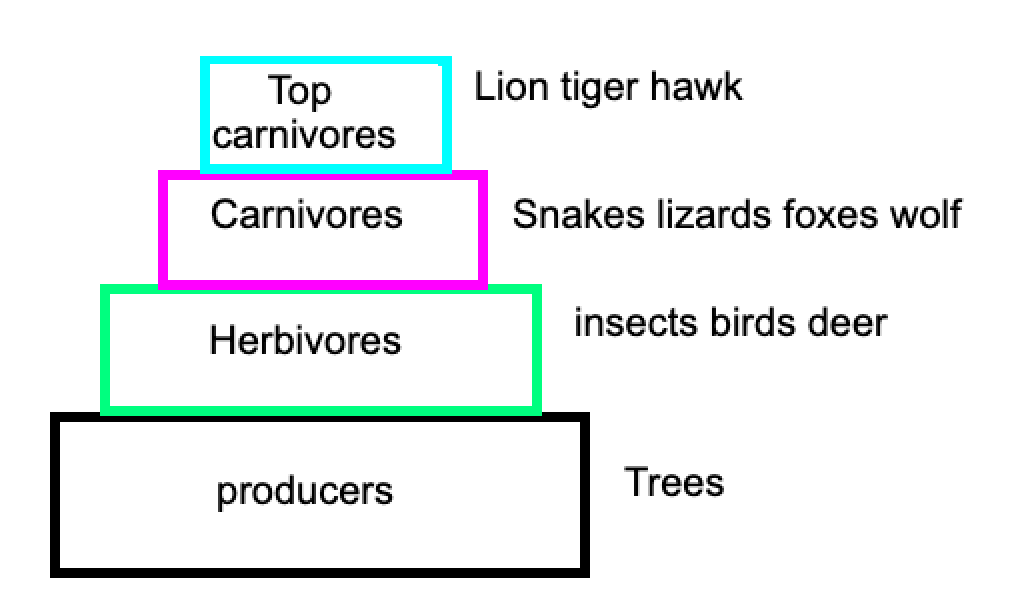
Pyramid of Biomass in a Forest Ecosystem (Upright)
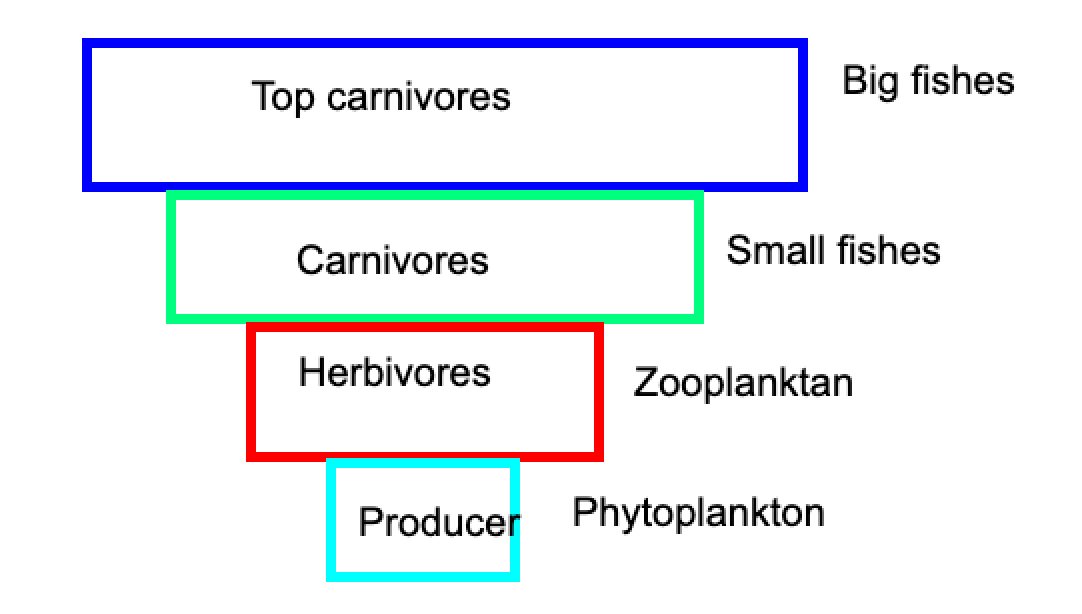
Pyramid of Biomass in a Pond Ecosystem (Inverted)
Energy Pyramid
- In every food chain, energy decreases as we move from one trophic level to the next.
- Only 10% of the energy stored at one level is transferred to organisms at the next tropic level.
- Thus, the producers have the highest energy, which gradually decreases at the next levels (consumers) of the food chain.
- Due to the above reason, the energy pyramid in an ecosystem is always upright.
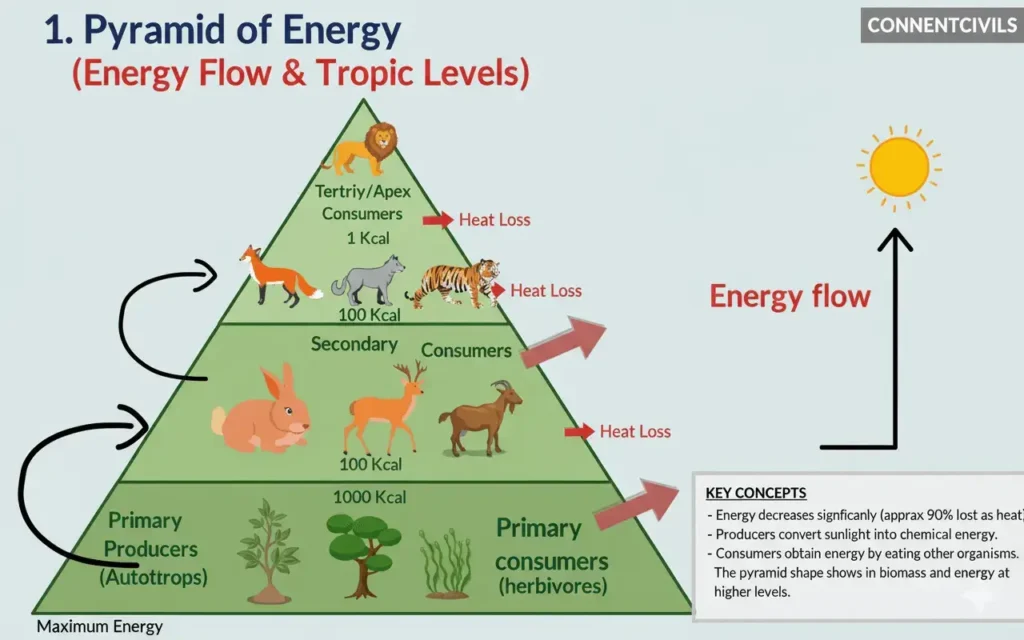
Pollution Indicators
- Lichens → Do not grow in polluted areas (especially high SO₂ pollution) → Indicators of clean air
- Seaweeds → Grow in polluted waters with heavy metals → Indicators of heavy metal pollution
- Weeds → Grow in both fertile and infertile soils → Indicators of soil condition (good/bad soils)
- River Otters → Disappear in polluted water → Presence indicates a healthy freshwater/marine ecosystem
- Daphnia, Trout fish, Shrimps, Stonefly larvae → Found in clean water only → Indicators of unpolluted water
- Typhifax (Annelida), Chitonomus larvae, E. coli, Sewage fungus, Sludge worm, Blood worm → Survive in polluted water → Indicators of water pollution
- Bats → Sensitive to light, heavy metals, and urban pollution → Indicators of ecological stress
- Marsh Periwinkles (Snails) → Decline in polluted marshes → Indicators of healthy marsh ecosystem
- Northern Spotted Owls → Decline with forest degradation → Indicators of forest health
- Diatoms → Composition changes with industrial/agricultural organic pollution → Indicators of organic & nutrient pollution
- Pseudomonas (bacteria) → Can survive in polluted environments → Indicators of organic pollution
- Gymnosperms → Less sensitive to pollution → Can survive in moderate pollution.
- Birds – Sensitive to toxins and habitat changes.
- Pigeons are bioindicators for heavy metal pollution (Pb, Zn) causing DNA damage.
- Honey Bees – Detect air pollution and radioactive particles (e.g., Strontium-90).
Corals
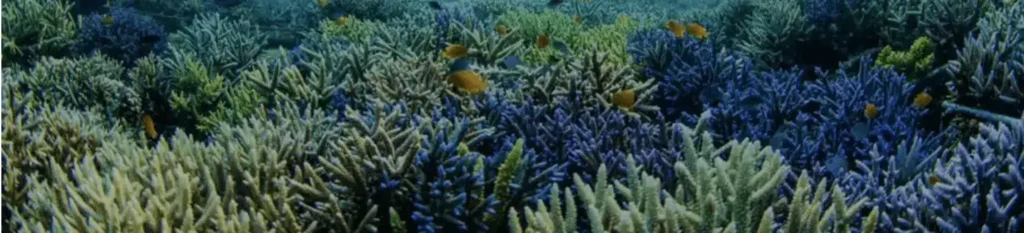
- Coral reefs are underwater ecosystems formed by colonies of coral polyps held together by calcium carbonate. It thrives in warm, shallow, and clear tropical waters.
- They are essentially animals, which are sessile (permanently attach themselves to the ocean floor).
- Corals share a symbiotic relationship with single-celled algae called zooxanthellae.
- The algae provide the coral with food and nutrients, which they make through photosynthesis.
- Although they cover less than 0.1% of the ocean floor, coral reefs are vital to marine biodiversity, supporting around 25% of all marine species by providing habitat, food, and breeding grounds for numerous organisms.
- Coral reefs are often called the “rainforests of the sea”.
Coral reef location
- Coral Triangle (Southeast Asia): The most biodiverse coral reef region often referred to as the Amazon of the seas’, encompassing Indonesia, the Philippines, Malaysia, Papua New Guinea, Timor-Leste, and the Solomon Islands.(home to 76 percent of the world’s coral species)
- Great Barrier Reef – It is the world’s largest coral reef system located on the north-east coast ofAustralia.
- India’s coral ecosystems extend across regions like the Gulf of Kutch, Gulf of Mannar, Palk Bay, Andaman and Nicobar Islands, and Lakshadweep Islands.
Coral Bleaching
- It occurs when (i) the densities of zooxanthellae decline, (ii) the concentration of photosynthetic pigments within the zooxanthellae falls.
Reasons
- Change in ocean temperature – Increased ocean temperature caused by climate change is the leading cause of coral bleaching.”
- Runoff and pollution – Storm generated precipitation can rapidly dilute ocean water and runoff can carry pollutants — these can bleach near-shore corals.
- High solar irradiance – When temperatures are high, high solar irradiance contributes to bleaching in shallow-water corals.
- Extreme low tides – Exposure to the air during extreme low tides can cause bleaching in shallow corals.
- Ocean acidification – Higher carbon dioxide levels decrease ocean pH, weakening coral skeletons and slowing growth. According to the National Oceanic and Atmospheric Administration, ocean acidity has increased by 30% since the Industrial Revolution.
- Climate Change – Ocean Warming, Sea Level Rise, Increased Storm Intensity can lead to coral deaths.
- Pollution – Marine Debris: Plastics and other debris physically damage corals and introduce toxins. In the Pacific Ocean, the Great Pacific Garbage Patch poses a severe threat to coral ecosystems.
- Overfishing and Destructive Fishing Practices.
- Human Activities – Unsustainable tourism, resource extraction, and careless recreational practices put immense pressure on the coral ecosystem.
Coral Reefs Types
 Fringing Reefs: These develop along the coastlines, separated from the shore by shallow lagoons.
 Barrier Reefs: These are found farther offshore, separated from land by deeper lagoons. The Great Barrier Reef is the largest example.
 Atolls: These are ring-shaped reefs that encircle a lagoon, often formed around sunken volcanic islands.
 Patch Reefs: Small, isolated reefs that grow from the ocean floor, usually within a lagoon, are Patch Reefs.
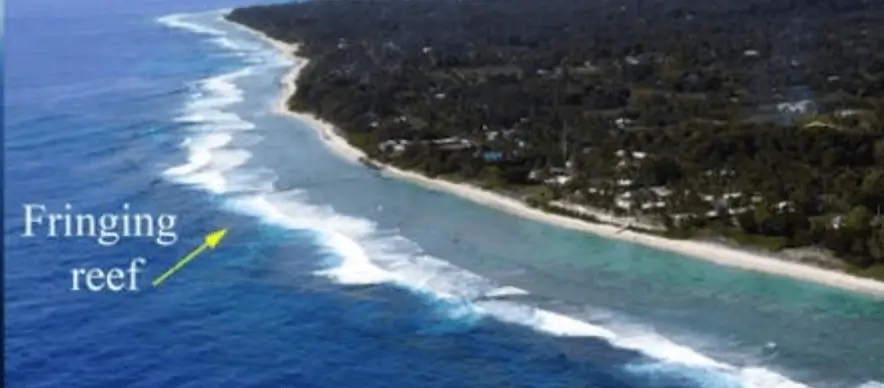


Initiatives for Coral Reef Conservation in India
- Wild Life Protection Act, 1972: All hard corals were included in Schedule I, providing the highest level of legal protection.
- Environment Protection Act, 1986 : Empowers the Central Government to protect marine environments and control marine pollution.
- Coastal Regulation Zone (CRZ) Notification 1991: Explicitly prohibits coral mining in India, safeguarding coastal and marine biodiversity.
- Marine Protected Areas (MPAs): Designated zones to preserve marine habitats, including coral reefs, while regulating fishing and tourism activities.
- Coral Reef Monitoring: Regular assessments of reef health and biodiversity to inform conservation strategies.
- National Coral Reef Research Centre: Conducts research and raises awareness about coral reef conservation.
Mangroves
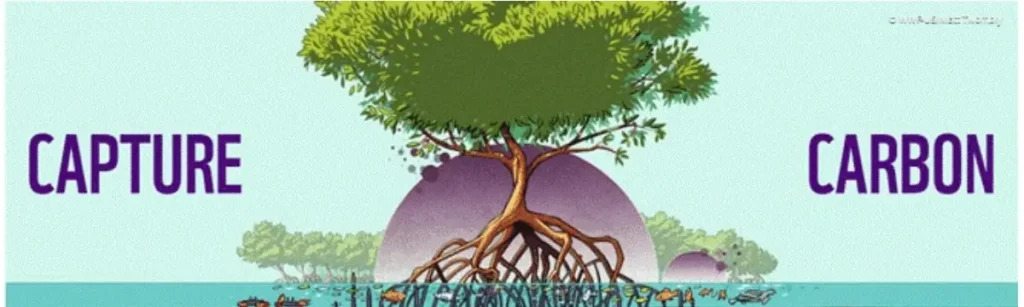
- A mangrove is a salt-tolerant plant community found in tropical and subtropical intertidal regions.
- These ecosystems thrive in high-rainfall areas (1,000–3,000 mm) with temperatures ranging from 26°C to 35°C. Mangrove species are adapted to survive in waterlogged soils, high salinity, and frequent tidal surges.
- They serve as crucial biodiversity refuges and act as bio-shields against extreme climatic events. Additionally, rural populations depend on mangroves for biomass-based livelihoods.
- Mangrove forests act as a crucial buffer between land and sea, providing habitat for various marine and terrestrial species.
- Importance – Mangroves: Nature’s Carbon Vault
- As per World Wildlife Fund mangroves store 7.5–10 times more carbon per acre than tropical forests.
- Their loss contributes to 10% of global greenhouse gas emissions from deforestation.
- These coastal forests hold over 21 gigatons of carbon, 87% of which is locked in the soil beneath their roots. Restoring just 1.6 million acres of lost mangrove forests could capture an additional 1 gigaton of carbon.
- Feature
- Aerial roots (pneumatophores): help in breathing in waterlogged soils.
- Prop roots: provide stability against waves & tides.
- Vivipary: seeds germinate while still attached to the parent tree → ensures survival in saline water.
- Efficient Carbon Sequestration.
According to the India State of Forest Report (ISFR) 2023.
- India’s total mangrove cover stands at 4,991.68 sq. km, constituting 0.15% of the nation’s geographical area. There has been a net increase of 363.68 Sq.km (7.86%) in Mangrove cover area of the country in 2023 as compared to 2013 and net increase of 509.68 Sq.km (11.4%) between 2001 and 2023.
- West Bengal has the largest mangrove cover (42.45%), followed by Gujarat (23.66%) and Andaman & Nicobar Islands (12.39%).
- The largest mangrove forest in India is the Sundarbans in West Bengal, which is also considered one of the largest mangrove ecosystems globally.
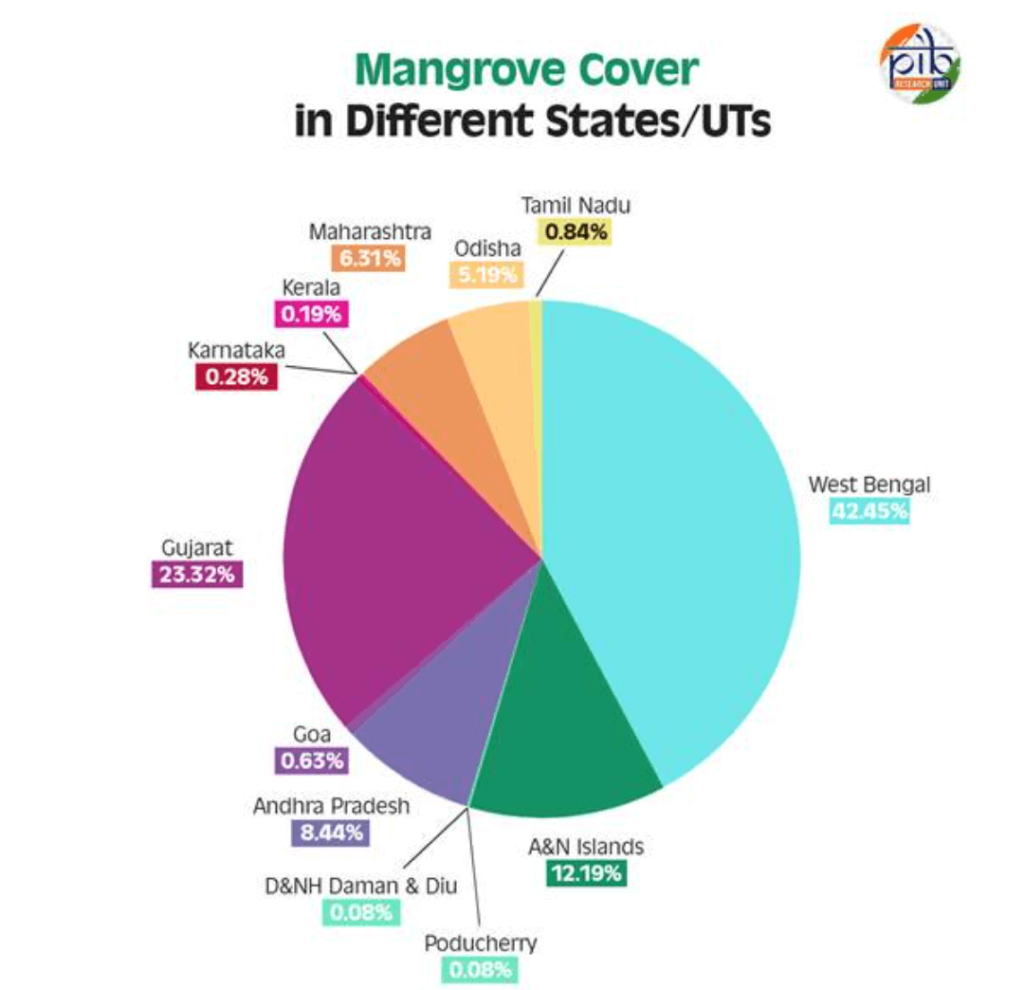
Indian Conservation Efforts for Mangroves
- Mangrove Initiative for Shoreline Habitats & Tangible Incomes (MISHTI):
- A government-led initiative launched in 2023 aimed at increasing the mangrove cover along the coastline and on salt pan lands.
- “MISHTI” comes after India joined the ‘Mangrove Alliance for Climate’ launched during the 27th Conference of Parties (COP27) to the UNFCCC held in Egypt in November 2022.
- It was launched by the Ministry of Environment, Forest & Climate Change on the occasion of World Environment Day, i.e., 5th June 2023.
- MISHTI envisages the restoration/reforestation of mangroves covering approximately 540 sq.km., spreading across 13 States/UTs for a period of five years commencing 2023-24 onwards
- The Magical Mangroves Campaign encourages citizens in coastal states to conserve mangroves.
- GCF-ECRICC Project (Green Climate Fund – Enhancing Coastal Resilience of Indian Coastal Community): Active since 2019 in Andhra Pradesh, Maharashtra, and Odisha.
- Sustainable Aquaculture In Mangrove Ecosystem (SAIME): It builds aquaculture farms that use sustainable integrated mangrove aquaculture systems. The project has been implemented in India and Bangladesh in collaboration with Global Nature Fund (GNF).
- Coastal Regulation Zone (CRZ) rules: It prohibits industrial activities, dumping of waste, and land reclamation in the CRZ to protect mangroves.
- Conservation and Management of Mangroves and Coral Reefs: To implement promotional measures to protect, sustain, conserve and augment mangrove forests.
- National Mangrove Committee: Set up in 1976 to advise the government on mangrove conservation and development.
Source : PIB
