
In Indian Geography, the population of India, characterized by rapid growth, uneven distribution, varying density, diverse sex ratios, literacy rates, and a mix of urban and rural populations, shapes the nation’s socio-economic landscape. These demographic factors, influenced by regional disparities, drive policy and development across states like Uttar Pradesh and Kerala.
Previous Year Question
| Year | Question | Marks |
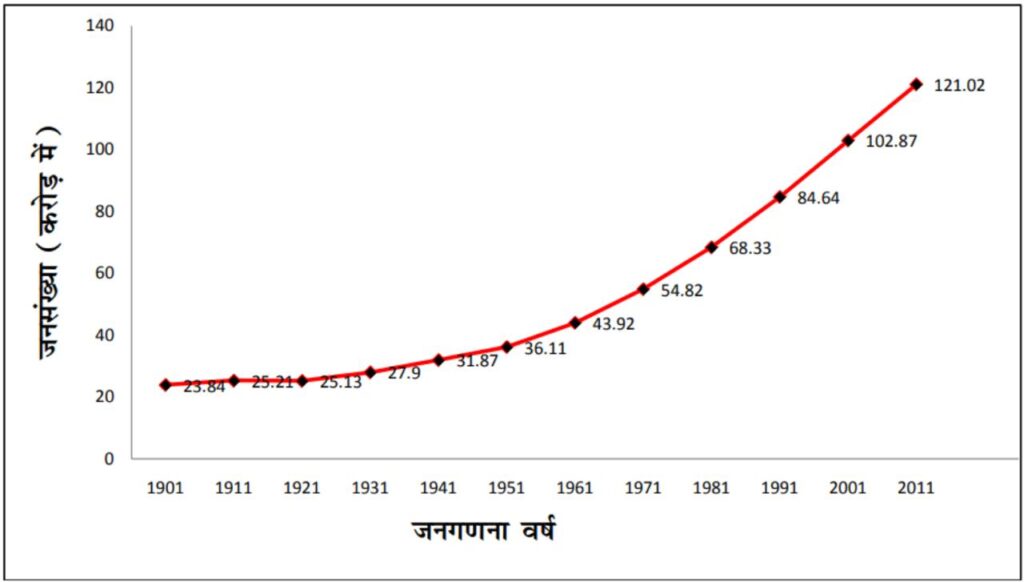
| 2016 | Discuss about the trends of population growth in India after the year 1900 to till date. | 5 M |
| 2018 | Describe the distinct phases of population growth in India from 1901 to 2011. | 5 M |
| 2023 | Discuss the period of high growth of population with declining trend (1981-2011) inIndia. | 5 M |
General Introduction
The progress of a country depends on the proper proportion of natural and human resources.
India has about 2.4% of the world’s area but 17.5% of the world’s population lives here. According to the 2011 census, the population of India is 121.085 crores
Note –According to the UN World Population Prospects 2024 report, India’s population is estimated to be 1.45 billion. [17.78% of the world’s total population] In April 2023, India’s population reached 1,425,775,850 people. [World’s most populous]
When the population density is more than the resources, the rate of economic development of the nation is usually slow and in comparison to the land resources, the population of India has crossed the optimum limit and has reached an explosive state.
For a developing country like India, this increasing population is responsible for country-wide problems like unemployment, starvation, poor living standards.
|
Facts |
|
Highlights of Census 2011
- The Census Commissioner of the 2011 Census was ‘Dr. C. Chandramouli’.
- The mascot was ‘enumerator lady ’ and the motto was “Our Census, Our Future” [Our Census, Our Future]
- A total of ’29 questions’ were included in the census.
- 17.5 percent of the world’s population lives in India and India’s population is equal to the total population of America, Indonesia, Brazil, Pakistan, Bangladesh and Japan.
- The two districts with the highest population are ‘Thane’ of Maharashtra and ‘North 24 Parganas’ of West Bengal.
- The ‘Dibang Valley’ of Arunachal Pradesh is the area with the least population. The population density here is only 1 person per square km.
- ‘Kurung Kumey’ of Arunachal Pradesh is the district with the highest population growth rate (113.5%) in the country.
- ‘Longleng’ district of Nagaland has recorded a negative population growth rate (-58.39%). North-East Delhi is the area with the highest population density in the country (37,346 persons per sq km).
- Puducherry’s ‘Mahe’ district is the district with the highest sex ratio (1,176).
- Daman’ district of Daman and Diu is the district with the lowest sex ratio (only 533).
- The highest literacy rate (98.76 percent) has been recorded in Serchhip district of Mizoram.
- Alirajpur district of Madhya Pradesh has the lowest literacy rate in the country (only 37.22%).
National Population Policy, 2000
- In 1952, India was the first country in the world to launch a national program for family planning.
- 1976 – Population policy announced for the first time in the country.
- A national population policy is formulated keeping in mind all the components like health, education, social security etc. under human resource development, to plan and manage the population in the context of food supply, land and resource constraints, and to incorporate demographic dividend for the betterment of the economy.
National Population Policy, 2000: Salient Features and Goals
- Total Fertility Rate (TFR): To reduce to replacement level of 2.1 by 2010 and achieve stable population by 2045
- Safe Delivery: 80% deliveries in hospitals and 100% by trained personnel.
- Infant Mortality Rate: To reduce to less than 30 per thousand.
- Maternal Mortality Rate: To reduce to less than 100 per lakh.
- Registration: To ensure registration of all births, deaths, marriages and pregnancies.
- Immunisation: To ensure 100% immunisation for preventable diseases.
- Minimum age of marriage: 18 years for girls and 21 years for boys.
- Awareness: Raising awareness about fertility control and availability of contraceptives.
- Family welfare programmes: Strong implementation of family planning programmes in the social sector.
Note – Almost all targets achieved.
Important Concept
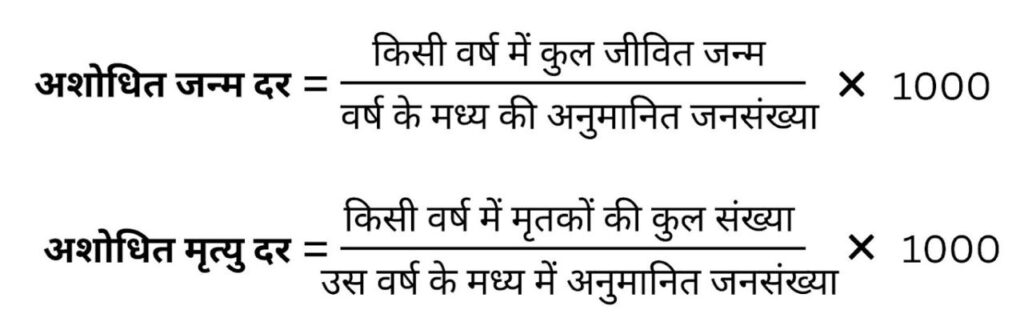
Crude birth rate – The number of live births per thousand. [SRS 2020 – 19.5]

Crude Death Rate – The number of deaths per thousand people in a population.
‘Migration’ –
- Movement from one place to another. It can be permanent or temporary.
- The movement of migrants to a new place i.e. the destination is called ‘immigration’.
- Moving or leaving the place of origin i.e. the place where one lives is called ’emigration’.
- Unemployment, low standard of living, adverse weather conditions, natural disaster, epidemic, political instability, social isolation, unrest etc. are ‘pull factors’ i.e. these factors force emigration.
- Employment, better standard of living, favourable climatic conditions, peace and stability, social harmony etc. are ‘pull factors’, that is, these factors induce migration.
Natural growth rate of population
- The difference in the total population of a place due to total births and total deaths after a certain period of time is called the ‘natural growth rate’ of the population.

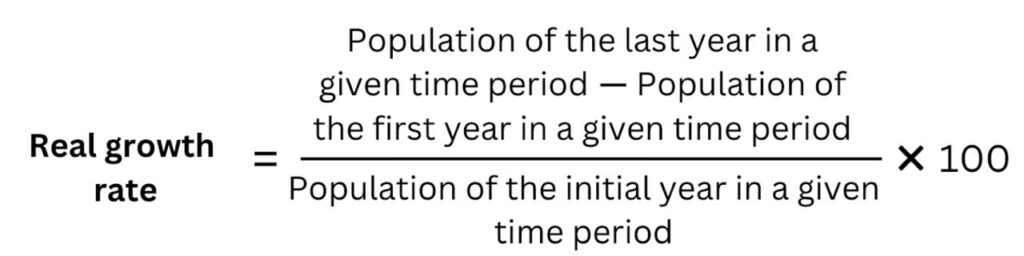
actual growth rate of population
- The actual growth rate of population in a given time period in an area is obtained by dividing the difference between the total population of the last year and the total population of the initial year by the total population of the initial year and multiplying it by 100.-
Infant mortality rate, child mortality rate and maternal mortality rate
- These are considered to be good indicators of health and nutrition conditions in any country.
- Infant Mortality Rate (IMR) – The number of deaths of infants aged 1 year or less per 1000 live births. [NFHS-5 (2019-21) – 35.2, SRS 2020 – 28]
- Child Mortality Rate (CMR) – The number of deaths of children up to 5 years of age per 1000 live births. [NFHS-5 (2019-21) – 41.9, SRS 2020 – 32]
- Neonatal Mortality Rate (NMR) – Neonatal mortality rate is defined as the number of deaths within the first 28 days of birth per 1,000 live births. [NFHS-5 (2019-21) – 24.9, SRS 2020 – 20]
- Maternal mortality rate (MMR) – is the number of deaths of mothers per one lakh live births. [SRS 2020 – 97]
- Total fertility rate (TFR) – indicates the average number of children a woman is expected to have during her reproductive life span of 15-49 years. [NFHS-5 (2019-21) – 2 (below replacement rate 2.1), SRS 2020 – 2.0]
Note – The total fertility rate in rural areas is still 2.1.
In urban areas, the TFR dropped below the replacement fertility rate only in the NFHS 2015-16.
- Replacement level – is the number of children needed to replace the parents, taking into account mortality rate, skewed sex ratio, infant mortality rate, etc. The population starts declining below this level.
- Contraceptive prevalence rate (CPR) – is the proportion of women who are currently using at least one contraceptive method, or whose sexual partner is currently using it, regardless of the method being used. Family planning: Contraceptive prevalence rate increased from 54% to 67%; unmet need decreased from 13% to 9%.
There has been a significant decrease in IMR, CMR, and MMR since independence till date, which shows that health facilities and nutrition conditions have improved in India. The decrease in TFR shows that family planning efforts and education and awareness have brought positive results in population management.
Population: Growth, distribution, density, sex ratio, literacy, urban and rural population / Population: Growth, distribution, density, sex ratio, literacy, urban and rural population / Population: Growth, distribution, density, sex ratio, literacy, urban and rural population
