
Financial Statement is an essential chapter in the subject Accounting & Auditing that focuses on the formal records of the financial activities of a business. It helps in presenting a clear picture of the company’s financial position, performance, and cash flows over a specific period. These statements are vital tools for investors, management, and other stakeholders to make informed decisions.
Financial Statement
Every businessman is interested in knowing about two facts i.e. whether he has earned a profit or suffered losses and what is his financial position. To fulfill above said purposes, the businessman prepares financial statements for his business.
Financial Statement
- Financial statements are the basic and formal annual reports ( that are prepared at the end of the accounting period) through which the corporate management communicates financial information to its owners and various other external parties which include investors, tax authorities, government, employees, etc.
- These include:
- Income Statement i.e. Trading and Profit & Loss Account
- Position statement i.e. Balance Sheet.
- Cash flow statement.
Objective
- The primary objective of financial statements is to assist the users in their decision-making.
- To provide information about economic resources and obligations of a business: to investors and other external parties.
- To provide information about the earning capacity of the business.
- To provide information about cash flows.
- To judge effectiveness of management.
- Information about activities of business affecting the society.
- Disclosing accounting policies.
Types of Financial Statements
Income statement
Income Statement – Shows a business’s income and expenses, divided into:
- Trading Account – Records trading activities (sales and purchases of goods and services). It helps determine Gross Profit or Gross Loss.
- Profit & Loss Account – Records non-trading activities like administrative expenses, selling & distribution costs, depreciation, financial expenses, and incomes (e.g., interest, commission, discounts received). It helps determine Net Profit or Net Loss.
- Combined Form – The Trading Account + Profit & Loss Account together form the Income Statement.

Position statement i.e. Balance Sheet
The financial position of a business is the list of assets owned by the business and the claims of various parties against these assets. The statement prepared to show the financial position is termed as Balance Sheet.

Trial Balance:
An accountant also wants to be sure that the ledger accounts he/she has prepared are correct in respect of amount, side, balance, etc. To check the accuracy of posting in the ledger a statement is prepared. This statement is called Trial Balance.
- A statement that ensures the ledger accounts are correctly recorded by checking that total debits = total credits.

Suspense A/c:
- Many times Trial Balance does not agree i.e. there is a difference of some amount in the totals of the two columns of the Trial Balance. In this case, a different account i.e Suspense Account is opened with the difference in amount put in this account.
- If the Trial Balance does not match, the difference is temporarily recorded in a Suspense Account until errors are identified and corrected.
Uses and Importance of Financial Statements
- Financial statements report the performance of the management to the shareholders.
- The financial statements provide basic input for industrial, taxation and other economic policies of the government.
- Credit granting institutions take decisions based on the financial performance of the undertakings.
- Financial statements help the investors to assess long term and short-term solvency as well as the profitability of the concern.
- Financial statements help the stock exchanges to understand the extent of transparency in reporting on financial performance and enables them to call for required information to protect the interest of investors.
- Helps in managerial decision making → Management make decisions after analysing financial statements.
Limitations of Financial Statements
- Financial statements are based on historical cost and do not reflect current market value.
- Accounting is done on the basis of certain conventions. Some of the assets may not realise the stated values, if the liquidation is forced on the company.
- Reports may have bias due to personal judgments and accounting conventions.
- They provide summary data, lacking detailed decision-making information.
- Important factors like market losses or contract cancellations are not disclosed.
- Only monetary data is recorded, ignoring qualitative aspects like work quality and employee relations.
- They show the financial position at a specific time but do not predict future changes.
Financial Statement Analysis
Previous Year Questions
| Year | Question | Marks |
| 2023 | Write down any five techniques of financial statements analysis. | 5 M |
| 2021 | Name any two methods of trend analysis. | 2 M |
| 2018 | What is Ratio Analysis with reference to Analysis of Financial Statements ? | 2 M |
| 2018 | What is Funds Flow Analysis Technique ? | 2 M |
| 2016 | What does the Balance-Sheet reveal ? Write any two points. | 2 M |
| 2016 Special | Write formulae of (i) Solvency Ratio (ii) Debt-Equity Ratio | 2 M |
| 2016 Special | Write any two objectives of Financial Statement Analysis. | 2 M |
- Financial Statement Analysis is the analysis and interpretation of Financial statements to draw conclusions and make decisions based on them.
- It establishes a meaningful relationship between various items of the two financial statements (Statement of Profit & Loss and Balance Sheet) with each other.
Need for Financial Statement Analysis?
Due to Limitation of Financial Statements : Financial statements are mainly prepared for decision-making purposes. One cannot make a conclusion or make a decision merely by having information; for that, it is necessary to analyze the available information by using different techniques and tools. Thus, an effective analysis and interpretation of financial statements is required.
Purpose/Objective of FSA
- Measure a business’s profitability and earning potential – To ascertain whether adequate profits are being earned on the capital invested in the business or not.
- Comparative study
- Intra-Firm – Compares the company’s profits over different years (Trend Analysis).
- Inter-Firm – Compares the company’s performance with competitors (Cross-Sectional Analysis).
- Efficiency of management– To assess the efficiency of management and efficient utilization of resources.
- Management Utility- To provide a sound basis to make important decisions.
- Solvency Analysis – Assesses the firm’s ability to repay debts in the short and long term.
- Reasons for deviation- To identify the reasons for deviation from profitability and other trends.
- Note: Purpose and benefits are the same.
Limitations of Financial Statement Analysis
- Limitations of Financial Statements – Financial statements may not always provide complete and authentic information.
- Affected by Window-dressing – Companies may manipulate financial statements to hide a weak financial position, e.g., delaying purchase records to show higher profits.
- Different Accounting Policies – The different firms adopt different accounting policies, it makes the comparison between the two firms unreliable.
- Difficulty in Forecasting – Since financial statements are based on past data, they may not always be useful for future predictions.
- Lack of Qualitative Analysis- Financial statements are expressed in terms of money. Qualitative aspects of business units such as changes in management, reputation of the business, cordial management-labour relations, firm’s ability to develop new products, efficiency of management, satisfaction of firm’s customers, etc, are not reflected.
The limitations of analysis must be kept in mind while making decisions based on the results obtained from such analysis.
Parties interested in the analysis of financial statements
- Investors- To know the earning capacity of the business for investment decisions.
- Management– To assess the performance of the firm and decision-making.
- Trade Unions– For negotiating wages or salaries or bonus agreements with the management.
- Lenders- To know the short-term as well as long-term solvency position of the firm.
- Suppliers and Trade Creditors- To know the short-term as well as long-term solvency position of the firm.
- Tax Authorities- For determining the tax liability.
- Researchers- For undertaking research work in business affairs and practices.
- Employees- For demanding better remuneration and a congenial working environment.
- Government and their Agencies- Need financial information to regulate the activities of the enterprises/industries and determine taxation policy
- Stock Exchange- As regulatory authority.
Types of Financial Analysis
Based on the source of Information (According to material used)
- Internal Analysis– This type of analysis is performed by the internal management who have complete access to the confidential business information and can perform an extensive analysis to get detailed and accurate information.
- External Analysis– This type of analysis is carried out by investors, stakeholders, researchers, etc., who rely upon the information published in various reports, such as Statement of Profit and Loss, Balance Sheet, etc., as they do not have access to the internal and confidential business information.
Based on the functionality/ Nature (Modus Operandi)
- Vertical Analysis/ Cross-Sectional Analysis: Analysis of the financial statement of a single year is known as Vertical analysis or Static analysis or Cross-Sectional analysis. It involves the study of the relationship between various items of a Statement of Profit and Loss, balance sheet, etc., in a single financial year. Examples : Common –Size financial statements, Financial Ratios.
- Horizontal Analysis/ Time Series Analysis: In this type of analysis, the financial statements of several years are compared with each other to understand the profitability of the business and its growth. It is also termed Dynamic analysis or Time series analysis. Examples : Comparative financial statements and trend percentages.
- Cross-sectional cum Time Series Analysis: Combination of the both.
| Horizontal Analysis | Vertical Analysis |
| Comparison of data from two or more years with Base year data. | Comparison of various components of a single year Financial Statement |
| Analyzes the same components of different years FS. | Analyzes different components of a single-year FS. |
| Time Series Analysis or Dynamic Analysis. | Static Analysis or Cross-Sectional Analysis. |
| Comparison of Financial status over some time. | Comparison of the financial status of a company to the other in the same financial year. |
| It provides informationin absolute andpercentage form. | It provides informationin percentage for money. |
| Eg. Comparing sales revenue of 2023 and 2024. | Comparing sales, expenses, and net profit of 2024. |
Techniques and Tools for Financial Analysis
Financial Statements indicate certain absolute information about assets, liabilities, equity, revenue and expenses of an organization. They are not readily understandable to the external users so analysts need to adopt various tools and techniques to make it useful to the third parties. A financial analyst can adopt the following tools and techniques for analysis of the financial statements:
- Comparative Financial Statements
- Common Size Financial Statements
- Trend Analysis
- Ratio Analysis
- Fund Flow Analysis
- Cash Flow Analysis
- Break Even Point Analysis
Comparative Financial Statements
- It is a technique of horizontal analysis and applicable to both financial statements – income statement and balance sheet.
- It provides meaningful information when compared to the similar data of prior periods.
- The types of comparative statements can be classified in to two forms, which are discussed as follows:
- Comparison of Balance Sheet
- Comparison of Income Statements.
- Absolute change from one period to another may be determined.
- It enables the identification of weak points and applying corrective measures.
Comparison of Balance Sheet
- It compares the different assets and liabilities of the firm on different dates (Eg. between 2022 and 2023).
- The changes in periodic balance sheet items reflect the conduct of a business whether the business is rising or falling.

Comparison of Income Statements
- It compares the different components of income statement such revenues earned (sales); expenses incurred, and net profit or loss.
- A comparative income statement helps analyze a company’s operational performance over different periods and draw conclusions about its profitability.
- It does provide indications of its future viability.

| Items | 2022-23 | 2023-24 | Change |
| Revenue | 50 Lakh | 60 Lakh | 10 Lakh |
| Expenses | 40 Lakh | 48 Lakh | 8 Lakh |
| Profit | 10 Lakh | 12 Lakh | 2 Lakh |
Common Size Financial Statements
- It is a technique of vertical analysis in which common size statements, balance sheet and income statements are shown in analytical percentages. The figures of financial statements are converted to percentages.
- It shows the relation of each component to the whole – Hence, the name common size.
- Common size statements are useful, both, in intra-firm comparisons over different years and also in making inter-firm comparisons for the same year or for several years.
- The common-size financial statements are of two types :
- Common size Balance Sheet
- Common size Income Statement
Common size Balance Sheet
- Items are expressed as the ratio of each asset to total assets and the ratio of each liability is expressed as a ratio of total liabilities.
- It can be used by different companies of different sizes for comparison.

Common size Income Statement
- Items are expressed in the ratio of each expense or earning to total income. (percentages of sales)
- It is helpful in evaluating operational activities of the enterprise.

Ratio Analysis
- It describes the significant relationship which exists between various items of a balance sheet and a statement of profit and loss of a firm.
- Ratio analysis is a technique of analyzing the financial statements by computations ratio.
- Ratio analysis provides a meaningful understanding of the performance and financial position of an enterprise.
- It helps the management to know the profitability, financial position ( liquidity and solvency) and operating efficiency of an enterprise.
Advantages of Ratio Analysis
- Useful in analysis of financial statements.
- Useful in simplifying accounting figures.
- Ratio analysis is an aid to measure general efficiency.
- Ratio analysis helps in planning and forecasting various issues.
- Useful in locating the weak spots.
- Useful in inter firm and intra firm comparison.
- Ratio analysis helps in facilitating decision making.
- Ratio analysis used to test profitability.
- Ratio analysis to test solvency position.
Types of Ratios
On the basis of FS used
- Profit & Loss account Ratios – A ratio of two variables from the statement of profit and loss is known as statement of profit and loss ratio. For example, ratio of gross profit to revenue from operations is known as gross profit ratio.
- Balance Sheet Ratio – In case both variables are from the balance sheet, it is classified as balance sheet ratios. For example, ratio of current assets to current liabilities known as current ratio.
- Inter Statement/Composite Ratios – If a ratio is computed with one variable from the statement of profit and loss and another variable from the balance sheet, it is called composite ratio
On the basis of the functionality
- Liquidity Ratio
- Profitability Ratio
- Capital Structure Ratio/Solvency Ratio
- Activity Ratio / Turnover Ratio
Liquidity Ratio
- Liquidity ratios are calculated to measure the short-term solvency of the business, i.e. the firm’s ability to meet its current obligations by looking at the amounts of current assets and current liabilities.
- It is a Balance Sheet Ratio.
- Liquidity ratios can be classified as follows:
Current ratio or working capital ratio
- It helps to assess the short term financial position of the enterprise.
- It is a relationship of current assets to current liabilities.

- Current assets that are either in the form of cash or cash equivalent or can be converted into cash and cash equivalent in a short term.
- Current liabilities are liabilities repayable in the short time. (within a year)
- Current ratio of 2:1 is considered satisfactory.
- Analysis of Current Ratio:
- A relatively high current ratio is an indication that the firm is liquid and the company has the ability to pay its current liabilities in time as and when they become due.
- A relatively low current ratio represents that the liquidity position of the firm is not good and the firm shall not be able to pay its current liabilities in time.
Liquid ratio or Quick ratio or Acid test ratio
- It measures the instant debt paying capacity of the business enterprise.
- It is a relationship of liquid assets to current liabilities.

- Quick assets = current assets – (stock + prepaid expense)
- Stocks are excluded from liquid assets because it may take some time before it is converted into cash.
- Prepaid expenses do not provide cash, and are excluded from liquid assets.
- It is calculated to serve as a supplementary check on liquidity position of the business and is therefore, also known as ‘Acid-Test Ratio’.
- Quick ratio 1:1 is usually considered favourable.
Activity Ratio / Turnover Ratio
- Activity ratios measure the efficiency or effectiveness with which a firm manages its resources or assets.
- These ratios are also called turnover ratios because they indicate the speed at which assets are converted or turned over in Revenue from operations (sales).
- The result is expressed in integers rather than as a percentage.
- Higher turnover ratio means better use of capital or resources, which in turn, means better profitability ratio.
- Activity ratios can be classified as follows:
Inventory (stock) turnover ratio

- Inventory turnover ratio measures the velocity of conversion of stock into sales.
- It indicates whether the investment in stock has been efficiently used or not.
- Higher ratio indicates that more sales are being produced by a unit of investment in stock.
Trade Receivable Turnover Ratio (Debtors Turnover ratio)

- It indicates the number of times the receivables are turned over in a year in relation to sales.
- It shows how quickly debtors are converted into cash.
- A high ratio is better since it would indicate that debts are being collected more promptly.
Trade Payables Turnover Ratio (Creditors Turnover Ratio)

- Trade Payables turnover ratio helps in judging the efficiency in getting the benefit of credit purchases offered by suppliers of goods.
- A high ratio indicates the shorter payment period and a low ratio indicates a longer payment period.
Working Capital Turnover Ratio

- Working capital = Current Assets – Current Liabilities
- It indicates whether the working capital has been effectively utilised or not.
- It is better than the stock turnover ratio since it shows the efficiency or inefficiency in the use of the entire working capital and not merely a part of it.
- Higher ratio indicates higher sales.
Capital Structure Ratio/Solvency Ratio
- The term ‘solvency’ implies ability of an enterprise to meet its long term indebtedness and it conveys an enterprise ability to meet its long term obligations.
- Long term solvency ratios indicate a firm’s ability to meet the fixed interest and costs and repayment schedules associated with its long-term borrowings.
- It helps the investor to analyse how a company is financing its operations and growth and its capital structure.
- Solvency ratios can be classified as follows:
Debt Equity Ratio (External-Internal Equity ratio)

- It portrays the proportion of total funds acquired by a firm by way of loans.
- Debt means long term loans, i.e., debenture, loans (long term) from financial institutions.
- Equity means shareholders’ funds, i.e., preference share capital, equity capital, reserves less losses and fictitious assets like preliminary expenses.
- It indicates the extent to which the firm depends upon outsiders for its existence.
- If the debt equity ratio is more than 2:1, it shows a rather risky financial position from the long term point of view.
Proprietary Ratio/ Equity Ratio

- This ratio shows the extent to which shareholders own the business.
- A high ratio indicates adequate safety for creditors.
- Shareholders’ Funds = Equity Share capital, Preference Share capital, undistributed profits reserves & surpluses.
Interest/Debt Service Coverage Ratio

- It determines the debt servicing capacity of a business enterprise.
- It measures the degree of protection creditors have from default on the payment of interest by the company.
- If a business enterprise is able to earn a return on the assets higher than the rate of interest on long-term debt, the enterprise makes an overall profit.
Capital gearing Ratio
- CGR = (Debt+Preferential share) / Equity share
- Also CGR= Fixed cost bearing capital / variable cost bearing capital
- It is the relationship of long-term debt and loans to net worth.
- High gearing means higher risk and higher return for equity holder.
- Low CGR increases confidence of investors in the firm.
Total Assets to Debt Ratio
- This ratio measures the extent of the coverage of long-term debts by assets.
- Debt Ratio = Total assets/Long-term debts
- The higher ratio indicates that assets have been mainly financed by owners funds and the long-term loans are adequately covered by assets.
Profitability Ratio
- It helps to know how much profit has been earned with the help of the amount invested in the business.
- These ratios examine the current operating performance and efficiency of the business concern.
- These ratios are helpful for the management to take remedial measures if there is a declining trend.
- The important profitability ratios are :
Gross Profit Ratio

- It helps to determine selling price so that there is adequate gross profit to cover the operating expenses, fixed charges, dividend and building up reserves.
- It helps to determine how much the selling price per unit may decline without resulting in losses on operations of the firms.
- Higher the rate of gross profit, lower the cost of revenue from operations.
Net Profit Ratio

- It is an indicator of overall efficiency of the business.
- It indicates the extent to which management has been effective in reducing the operational expenses.
- Higher the net profit ratio betters the business
Operating Profit Ratio

- This ratio indicates the proportion that the cost of sales or operating cost bears to sales.
- It tests the operational efficiency of the business.
- Operating Profit = Gross Profit – (Administration expenses + selling expenses)
Return on Investment (ROI) or Return on Capital Employed Ratio

- It measures how efficiently the sources entrusted to the business are used.
Market Test Ratio
- It is used to evaluate the value of a company in comparison to its book value.
- It measures the market value of a company’s shares relative to the value of assets on balance sheets.


Trend Analysis
- It is a technique of studying the operational results and financial position over a series of years. Eg.- Trends of sales of Air Conditioners over the 10 years.
- Using the previous years data of a business enterprise, trend analysis can be done to observe the percentage changes over time in the selected data.
- The trend percentage is the percentage relationship, in which each item of different years bears the same item in the base year.
- Trend analysis is important because, with its long run view, it may point to basic changes in the nature of the business. By looking at a trend in a particular ratio, one may find whether the ratio is falling, rising or remaining relatively constant. From this observation, a problem is detected or the sign of good or poor management is detected.
Methods of Trend Analysis
- Trend Percentage Method – This method involves selecting a base year and expressing the financial data of subsequent years as a percentage of the base year. It helps in analyzing growth patterns over time.
- Graphical Analysis – Represents financial trends visually using line charts, bar graphs, or histograms.
- Least Squares Method – Uses statistical regression to predict future trends based on historical data.
- Index Number Method – Converts financial data into index numbers to observe percentage changes over time.
Cash Flow Analysis
- A firm needs cash to make payment to its suppliers, to incur day-to-day expenses and to pay salaries, wages, interest and dividends etc.
- It is very essential for a business to maintain an adequate balance of cash.
- It refers to the analysis of actual movement of cash into and out of an organisation.
- The flow of cash into the business is called cash inflow or positive cash flow and the flow of cash out of the firm is called cash outflow or a negative cash flow. The difference between the inflow and outflow of cash is the net cash flow.
- Cash flow statement is prepared to project the manner in which the cash has been received and has been utilised during an accounting year as it shows the sources of cash receipts and also the purposes for which payments are made.
- Cash flow analysis is done by analysing three categories of cash inflows and outflows i.e.
- Operating activities
- Investing activities
- Financing activities
- Thus, it summarises the causes for the changes in cash position of a business enterprise between dates of two balance sheets.
Fund Flow Analysis
- Fund flow statement is a statement prepared to analyse the reasons for changes in the financial position of a company between two balance sheets.
- It analyzes both cash (and cash equivalent) and non-cash transactions.
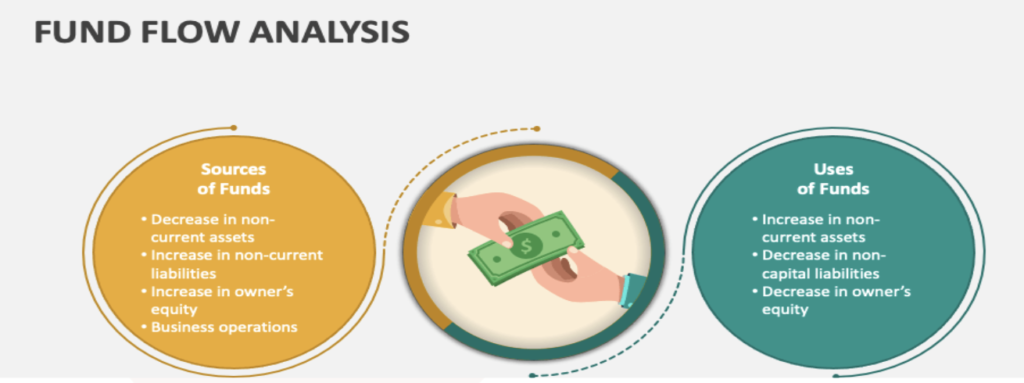
- It portrays the inflow and outflow of funds i.e. sources of funds and applications of funds for a particular period.
- Sources of funds: It talks about the extent of funds availed from
- Owners
- Outsiders
- Application of funds: It talks about how the funds have been utilized
- Funds deployed in Fixed assets
- Funds deployed in Current assets
- Sources of funds: It talks about the extent of funds availed from
- It explains the managers of funds as to why the company is sitting in liquidity strain despite making profits.
- It helps the managers to understand how a company is financially strong despite losses
Break Even Point Analysis
- The Break-Even Point (BEP) is the level at which total cost = total revenue, meaning there is no profit and no loss.
- Beyond this point, the firm starts making a profit.
- This method helps the manager in managerial decisions like profit, planning, cost control.


- Fixed cost refers to the cost incurred in a business unit, which doesn’t depend upon the volume of production. For example, rent, loans, insurance premiums, etc. comes under fixed cost.
- Variable cost: Costs that change with production levels. Cost to produce one unit of product. (e.g., raw material costs).

FAQ (Previous year questions)
Capital = Total Assets−Current Liabilities
Total Assets = Fixed Assets + Current Assets (Stock + Sundry Debtors + Cash)
= ₹4,00,000+₹90,000=₹4,90,000
Current Liabilities = ₹85,000
Capital = ₹4,90,000 − ₹85,000 = ₹4,05,000
Formula: Current Ratio = Current Assets / Current Liabilities
- Current Assets = Cash and Bank + Trade Receivables + Inventory
= ₹30,000 + ₹75,000 + ₹30,000 = ₹1,35,000
- Current Liabilities = Trade Payables = ₹45,000
- Current Ratio = ₹1,35,000 / ₹45,000 = 3 : 1
Formula: Quick Ratio = Quick Assets / Current Liabilities
- Quick Assets = Current Assets – Inventory = ₹1,35,000 – ₹30,000 = ₹1,05,000
- Quick Ratio = ₹1,05,000 / ₹45,000 = 2.33 : 1
Formula: Receivables Turnover Ratio = Net Credit Sales / Average Trade Receivables
= ₹4,50,000 / ₹75,000 = 6 times
Formula: Inventory Turnover Ratio = Cost Of Goods Sold / Average Inventory
= ₹3,15,000 / ₹30,000 = 10.5 times
Formula: Gross Profit Ratio = (Gross Profit / Sales) × 100
- Gross Profit = Sales- Cost of Goods Sold = ₹4,50,000 – ₹3,15,000 = ₹1,35,000
- Gross Profit Ratio = (₹1,35,000 / ₹4,50,000) × 100 = 30%
Financial statements show a company’s assets, liabilities, equity, revenue, and expenses, but they may not be easily understood by external users. To analyze them effectively, financial analysts use various tools:
- Comparative Statements Analysis – Compare financial data across periods. Helps in identifying growth patterns, strengths, and weaknesses.
- Common Size Statements Analysis – Expresses each item as a percentage of a base figure (e.g., total assets or total sales). Useful for comparing companies of different sizes and identifying structural changes.
- Trend Analysis – Identifies financial patterns over time. Helps in forecasting and strategic decision-making.
- Ratio Analysis – Uses financial ratios to assess a company’s profitability, liquidity, solvency, and efficiency.
- Break-Even Analysis – Determines the level of sales required to cover total costs (fixed and variable). Helps in pricing decisions, cost control, and profitability planning.
- Fund Flow Analysis – Analyzes the movement of funds within the business, focusing on sources and uses of working capital.
- Cash Flow Analysis – Examines cash inflows and outflows from operating, investing, and financing activities.
Methods of Trend Analysis
- Trend Percentage Method – This method involves selecting a base year and expressing the financial data of subsequent years as a percentage of the base year. It helps in analyzing growth patterns over time.
- Graphical Analysis – Represents financial trends visually using line charts, bar graphs, or histograms.
- Least Squares Method – Uses statistical regression to predict future trends based on historical data.
- Index Number Method – Converts financial data into index numbers to observe percentage changes over time.
Ratio Analysis is a financial tool that evaluates a firm’s profitability, liquidity, solvency, and efficiency by analyzing relationships between financial statement (Balance Sheet and Profit & Loss Statement) items for better planning and decision-making.
- It uses financial ratios. Key ratios include:
- Liquidity Ratios (e.g., Current Ratio, Quick Ratio)
- Profitability Ratios (e.g., Net Profit Margin, Return on Equity)
- Solvency Ratios (e.g., Debt-to-Equity Ratio)
- Efficiency Ratios (e.g., Inventory Turnover Ratio).
Fund flow analysis is a financial management technique that examines the movement of funds (inflows and outflows) within an organization.
- It analyzes changes in a company’s financial position between two balance sheets.
- It involves monitoring the sources and uses of funds to gain insights into financial trends and operational efficiency.
- It assists managers in assessing liquidity, financial strength, and fund utilization for informed decision-making.
A company’s balance sheet, also known as a “Statement of financial position,” reveals
- Financial Position : The firm’s assets, liabilities, and owners’ equity (net worth) at a specific point in time.
- Solvency and Liquidity : It helps to assess a company’s ability to meet short-term and long-term obligations by analyzing its current and non-current liabilities against available assets.
- A balance sheet must balance out where assets = liabilities + owner’s equity.
(i) Solvency Ratio : The solvency ratio measures a company’s ability to meet its long-term obligations.

(ii) Debt-Equity Ratio :This ratio shows how much debt is being used to finance the company’s assets relative to the value of shareholders’ equity.


Objectives of Financial Statement Analysis
- Measure a business’s profitability and earning potential – To ascertain whether adequate profits are being earned on the capital invested in the business or not.
- Comparative study
- Intra-Firm – Compares the company’s profits over different years (Trend Analysis).
- Inter-Firm – Compares the company’s performance with competitors (Cross-Sectional Analysis).
- Efficiency of management– To assess the efficiency of management and efficient utilization of resources.
- Management Utility- To provide a sound basis to make important decisions.
- Solvency Analysis – Assesses the firm’s ability to repay debts in the short and long term.
- Reasons for deviation- To identify the reasons for deviation from profitability and other trends.
(i) Fixed Assets: ₹ 4,00,000
(ii) Current Liabilities: ₹ 85,000
(iii) Stock, Sundry Debtors and Cash: ₹ 90,000
Capital = Total Assets−Current Liabilities
Total Assets = Fixed Assets + Current Assets (Stock + Sundry Debtors + Cash)
= ₹4,00,000+₹90,000=₹4,90,000
Current Liabilities = ₹85,000
Capital = ₹4,90,000 − ₹85,000 = ₹4,05,000
Cash and Bank Balance: ₹ 30,000
Trade Payables: ₹ 45,000
Trade Receivables: ₹ 75,000
Inventory: ₹ 30,000
Sales(all credit): ₹ 4,50,000
Cost of Goods Sold: ₹ 3,15,000
Calculate: (i) Current ratio, (ii) Quick Ratio, (iii) Receivables Turnover Ratio (iv) Inventory Turnover Ratio (v) Gross Profit Ratio
Formula: Current Ratio = Current Assets / Current Liabilities
Current Assets = Cash and Bank + Trade Receivables + Inventory
= ₹30,000 + ₹75,000 + ₹30,000 = ₹1,35,000
Current Liabilities = Trade Payables = ₹45,000
Current Ratio = ₹1,35,000 / ₹45,000 = 3 : 1
Formula: Quick Ratio = Quick Assets / Current Liabilities
Quick Assets = Current Assets – Inventory = ₹1,35,000 – ₹30,000 = ₹1,05,000
Quick Ratio = ₹1,05,000 / ₹45,000 = 2.33 : 1
Formula: Receivables Turnover Ratio = Net Credit Sales / Average Trade Receivables
= ₹4,50,000 / ₹75,000 = 6 times
Formula: Inventory Turnover Ratio = Cost Of Goods Sold / Average Inventory
= ₹3,15,000 / ₹30,000 = 10.5 times
Formula: Gross Profit Ratio = (Gross Profit / Sales) × 100
Gross Profit = Sales- Cost of Goods Sold = ₹4,50,000 – ₹3,15,000 = ₹1,35,000
Gross Profit Ratio = (₹1,35,000 / ₹4,50,000) × 100 = 30%
Financial statements show a company’s assets, liabilities, equity, revenue, and expenses, but they may not be easily understood by external users. To analyze them effectively, financial analysts use various tools:
Comparative Statements Analysis – Compare financial data across periods. Helps in identifying growth patterns, strengths, and weaknesses.
Common Size Statements Analysis – Expresses each item as a percentage of a base figure (e.g., total assets or total sales). Useful for comparing companies of different sizes and identifying structural changes.
Trend Analysis – Identifies financial patterns over time. Helps in forecasting and strategic decision-making.
Ratio Analysis – Uses financial ratios to assess a company’s profitability, liquidity, solvency, and efficiency.
Break-Even Analysis – Determines the level of sales required to cover total costs (fixed and variable). Helps in pricing decisions, cost control, and profitability planning.
Fund Flow Analysis – Analyzes the movement of funds within the business, focusing on sources and uses of working capital.
Cash Flow Analysis – Examines cash inflows and outflows from operating, investing, and financing activities.
Methods of Trend Analysis
Trend Percentage Method – This method involves selecting a base year and expressing the financial data of subsequent years as a percentage of the base year. It helps in analyzing growth patterns over time.
Graphical Analysis – Represents financial trends visually using line charts, bar graphs, or histograms.
Least Squares Method – Uses statistical regression to predict future trends based on historical data.
Index Number Method – Converts financial data into index numbers to observe percentage changes over time.
Ratio Analysis is a financial tool that evaluates a firm’s profitability, liquidity, solvency, and efficiency by analyzing relationships between financial statement (Balance Sheet and Profit & Loss Statement) items for better planning and decision-making.
It uses financial ratios. Key ratios include: Liquidity Ratios (e.g., Current Ratio, Quick Ratio)
Profitability Ratios (e.g., Net Profit Margin, Return on Equity)
Solvency Ratios (e.g., Debt-to-Equity Ratio)
Efficiency Ratios (e.g., Inventory Turnover Ratio).
Fund flow analysis is a financial management technique that examines the movement of funds (inflows and outflows) within an organization.
It analyzes changes in a company’s financial position between two balance sheets.
It involves monitoring the sources and uses of funds to gain insights into financial trends and operational efficiency.
It assists managers in assessing liquidity, financial strength, and fund utilization for informed decision-making.
A company’s balance sheet, also known as a “Statement of financial position,” reveals
Financial Position : The firm’s assets, liabilities, and owners’ equity (net worth) at a specific point in time.
Solvency and Liquidity : It helps to assess a company’s ability to meet short-term and long-term obligations by analyzing its current and non-current liabilities against available assets.
A balance sheet must balance out where assets = liabilities + owner’s equity.
(i) Solvency Ratio : The solvency ratio measures a company’s ability to meet its long-term obligations.
(ii) Debt-Equity Ratio :This ratio shows how much debt is being used to finance the company’s assets relative to the value of shareholders’ equity.
Objectives of Financial Statement Analysis
Measure a business’s profitability and earning potential – To ascertain whether adequate profits are being earned on the capital invested in the business or not.
Comparative study Intra-Firm – Compares the company’s profits over different years (Trend Analysis).
Inter-Firm – Compares the company’s performance with competitors (Cross-Sectional Analysis).
Efficiency of management– To assess the efficiency of management and efficient utilization of resources.
Management Utility- To provide a sound basis to make important decisions.
Solvency Analysis – Assesses the firm’s ability to repay debts in the short and long term.
Reasons for deviation- To identify the reasons for deviation from profitability and other trends.
