
This post includes Macro Indicators of Rajasthan Economy in 2020-21 which are published in 2021. The facts & figures are based on data published in Economic Review of Rajasthan 2021 and State Budget 2020-21.
Key Indicators of Rajasthan Economy
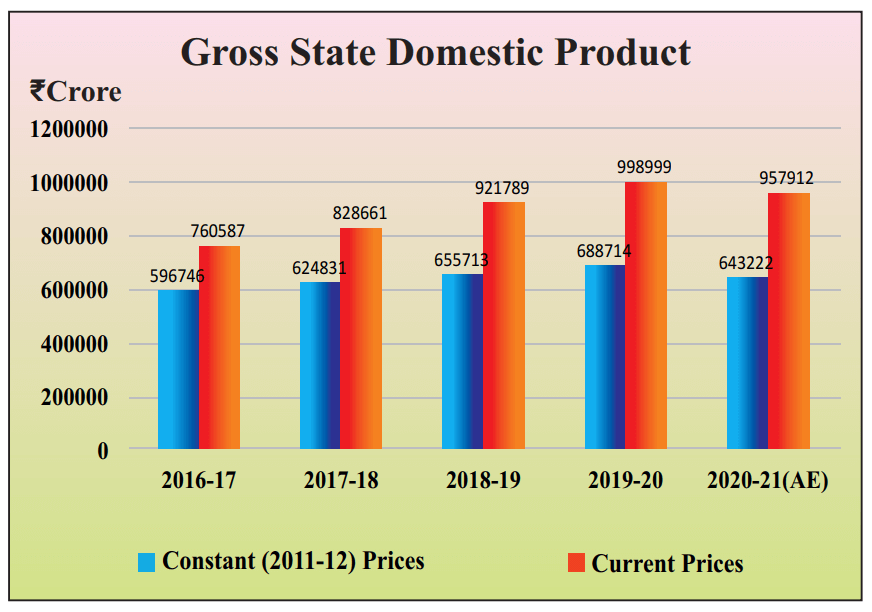
Gross State Domestic Product of Rajasthan at:
- (a) Constant (2011-12) Prices: 6,43,222 Crores
- (b) Current Prices: 9,57,912 Crores
Economic Growth Rate as per GSDP at:
- (a) Constant (2011-12) Prices: -6.11%
- (b) Current Prices: -4.11%

Sectoral Contribution of GVA at Current Prices by
- (a) Agriculture: 29.77%
- (b) Industry: 24.80%
- (c) Services: 45.43%

Net State Domestic Product at
- (a) Constant (2011-12) Prices: 5,70,143 Crores
- (b) Current Prices: 8,62,633 Crores

Per Capita Income at
- (a) Constant (2011-12) Prices: 72,297 INR
- (b) Current Prices: 1,09,386 INR

Key Indicators of the State vis-a-vis India
| Indicators | Year | Rajasthan | India | Unit |
|---|---|---|---|---|
| Geographical Area | 2011 | 3.42 | 32.87 | Lakh Sq. Km. |
| Population | 2011 | 6.85 | 121.09 | Crore |
| Decadal Growth Rate | 2001-2011 | 21.3 | 17.7 | Percentage |
| Population Density | 2011 | 200 | 382 | Population Per Sq. Km |
| Urban Population to total Population | 2011 | 24.9 | 31.1 | Percentage |
| Scheduled Caste Population | 2011 | 17.8 | 16.6 | Percentage |
| Scheduled Tribe Population | 2011 | 13.5 | 8.6 | Percentage |
| Sex Ratio | 2011 | 928 | 943 | Female Per 1,000 Male |
| Child Sex Ratio (0-6 Year) | 2011 | 888 | 919 | Female Children Per 1,000 Male Children |
| Literacy Rate | 2011 | 66.1 | 73 | Percentage |
| Literacy Rate (Male) | 2011 | 79.2 | 80.9 | Percentage |
| Literacy Rate (Female) | 2011 | 52.1 | 64.6 | Percentage |
| Work Participation Rate | 2011 | 43.6 | 39.8 | Percentage |
| Birth Rate | 2018* | 24 | 20 | Per 1,000 Population |
| Death Rate | 2018* | 5.9 | 6.2 | Per 1,000 Population |
| Infant Mortality Rate | 2018* | 37 | 32 | Per 1,000 Live Birth |
| Maternal Mortality Ratio | 2016-18* | 164 | 113 | Per Lakh Live Birth |
| Life Expectancy at Birth | 2014-18* | 68.7 | 69.4 | Year |
Price Inflation Indices Rajasthan:
- The Directorate of Economics and Statistics (DES) has been collecting the wholesale and retail prices of the essential commodities regularly, since 1957 from selected centres across the State on weekly basis.
- The Consumer Price Indices for industrial workers are prepared and released by the Labour Bureau, Shimla for Jaipur, Ajmer and Bhilwara centres of the State.
- The DES also prepares Building Construction Cost Index for Jaipur Centre.
Wholesale Price Index (WPI) Rajasthan
- Base Year 1999-2000=100
- The primary use of the state level WPI is in computation of GSDP as an indicator.
- WPI serves as an important determinant in formulation of trade, fiscal and other economic policies by the government.
- It is also widely used by the banks, industries and business circles. It is released on monthly
- It covers 154 commodities, of which 75 are from ‘Primary Articles’ group, 69 fromManufactured Products’ group and 10 from ‘Fuel and Power’ group.
- The Wholesale Price Index for ‘All Commodities’ moved from 310.56 in the year 2019 to 330.86 in the year of 2020, registered an increase of 6.54 per cent.
Consumer Price Index (CPI)
- At present there are four different types of Consumer Price Indices are being constructed every month. They are Consumer Price Index for
- Industrial Workers (CPI-IW)
- Agricultural Labourers (CPI-AL)
- Rural Labourers (CPI-RL) and
- Rural, Urban (CPI-R&U).
- The first three indices are constructed and released by the Labour Bureau, Shimla and the fourth one by the Central Statistical Office (CSO), New Delhi.

Disclaimer: Data & figures are sourced from Rajasthan Economic Review 2020-21 published in February 2021. RajRAS has only republished the data in simple manner for understanding of users.
